Questions
When your QC is a flat line
What happens when your QC is literally a straight line? What might be happening?
Frequently-Asked-Questions: What do you do when your QC is just a line?
December 2019
Sten Westgard, MS
One of the frequent questions we come across has to do with QC charts that lack the traditional variation. Sometimes the QC chart is flat, in extreme cases, a straight line. Take the three graphs below and see what you think.
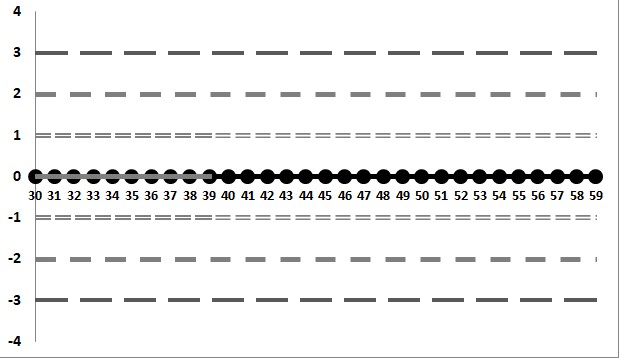
Chart one: a basic straight line.
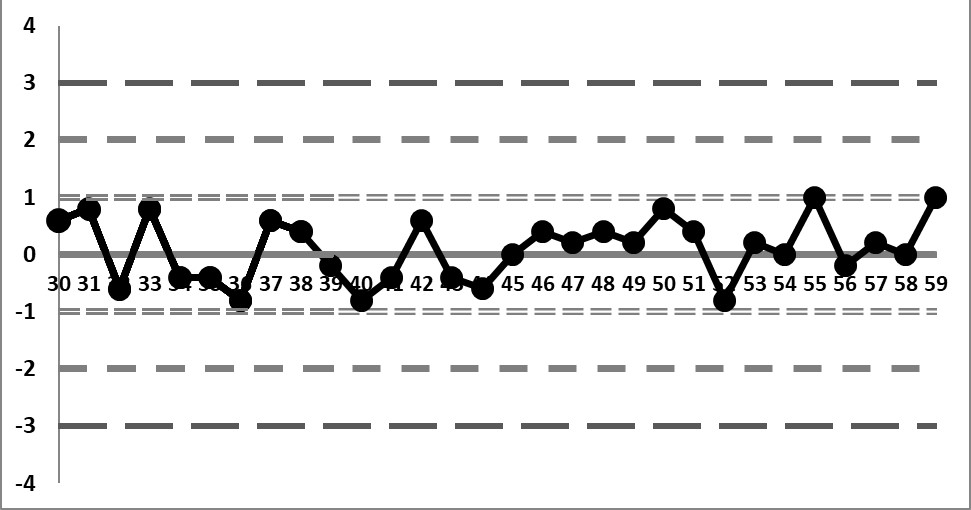
Now here's the second chart: where we can see some variation.
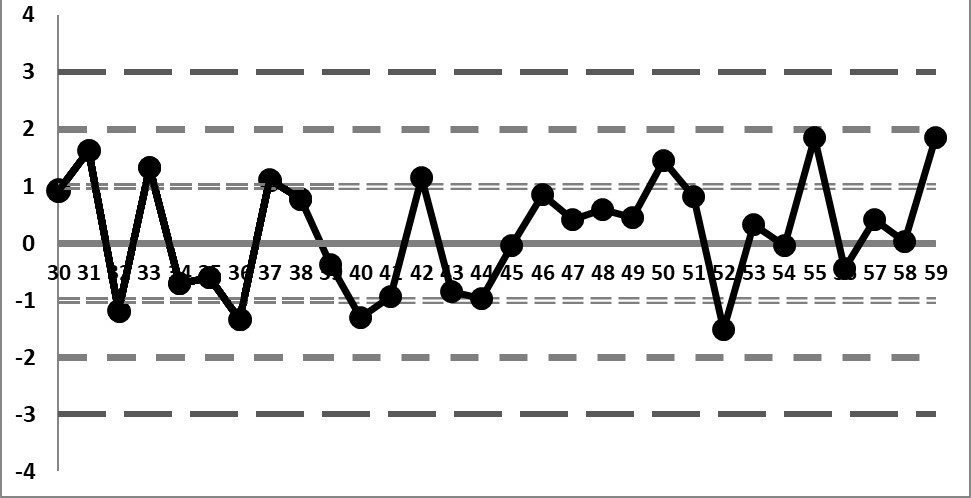
Finally, here's chart three. Now the variation begins to seem more like "normal" variation, where the values fluctuate more than 1 SD.
So, what's the trick here?
It's all the same data - just with different decimal places.
When there is only 1 decimal place, the rounding effect removes all the variation from the chart. We get a flat line.
When there is another decimal place added, we see variation.
When the third decimal place is added, AND we adjust the SD to better reflect the actual variation of the data we're seeing, we begin to see the variation that looks like what we're supposed to see. Data that bounces up and down, some of it that may come closer to 2 standard deviations.
Let's admit this is an artificial data set, a set of random numbers. But when we round those numbers, we lose variation. And we lose sight of the control of the method.
It's well known that adding an extra decimal place can give a laboratory additional insight into their monitoring of quality of methods. Even if those extra decimal places are not reported out to clinicians, they may be valuable for operational monitoring.
Equally important is how you set up the charts: make sure you have the correct standard deviation for your control limits, preferably the one that actually represents your performance. Using a manufacturer's mean or SD or a set of ranges from control inserts may be useful temporarily, but in the long run, those larger ranges will minimize and obscure variation.