Sigma Metric Analysis
An Erba XL-640 in Gujarat India
A recent study of the Erba XL-640 found some disturbing results. What should a lab do when everything goes wrong?
An Erba XL-640 in Guajarat, India
June 2026
Sten Westgard, MS
[Sigma score: long-term imprecision: +0.5; controls near decision points: +0.5; long-term bias: +0.5; Final Score: 1.5. Somewhere between Optimistic and Possibly Misleading. ]
A recent study looked at the Erba XL-640 performance at an Indian laboratory:
Application of Six Sigma metrics for Quality Assurance and Continuous Quality Improvement in Clinical Biochemistry Testing, Prashant Manubhal, Chirag Valera, Ramesh Pradjan, Advances in Clinical Medical Research, Vol 7 No 02, April-June 2026.
We have analyzed Erba instruments before on Westgard Web, here and here, this latest paper gives us one more look at the instruments.
Calculating Sigma metrics from routine laboratory performance data.
The imprecision and bias of the analyzers
"Internal Quality Control (IQC) and External Quality Assessment (EQA) data of 14 routinely analyzed biochemical parameters were collected and evaluated. All biochemical analyses were performed on the fully automated clinical chemistry analyzer, Erba XL-640 (Transasia Bio-Medicals Ltd, India)....Two levels of commercial quality control materials (Level I and Level II) were used for each biochemical parameter.... IQC data collected over five consecutive months were used to determine analytical imprecision, whereas EQA data were utilized to estimate analytical bias." EQA bias was averaged over the same 5 months.
The study used the CLIA 1992 total allowable error goals. We updated the calculations in this analysis to the CLIA 2025 goals.
Imprecision was assessed for this study over a 5 month period. using "commercial quality control materials." It is unclear if these are manufacturer-provided controls, or if they are independent 3rd party controls. 3rd party controls are of course preferred.
| Test | TEa Source | TEa | % Bias | % CV | Sigma |
| Albumin | CLIA 2025 | 8 | 4.57 | 2.27 | 1.51 |
| Albumin | 8% | 8 | 4.57 | 1.9 | 1.81 |
| Alk Phos | CLIA 2025 | 20 | 9.97 | 5.65 | 1.78 |
| Alk Phos | 20% | 20 | 9.97 | 3.13 | 3.20 |
| ALT | CLIA 2025 6 U/L or 15.% | 15 | 26.95 | 7.35 | negative |
| ALT | 6 U/L or 15.% | 15 | 26.95 | 6.85 | negative |
| AST | 6 U/L or 15.% | 15 | 15.81 | 7.15 | negative |
| AST | 6 U/L or 15.% | 15 | 15.81 | 6.75 | negative |
| Bilirubin, Total | CLIA 2025 | 20 | 6.34 | 5.86 | 2.33 |
| Bilirubin, Total | 20 | 6.34 | 3.01 | 4.54 | |
| Cholesterol | CLIA 2025 | 10 | 3.57 | 3.87 | 1.66 |
| Cholesterol | 10% | 10 | 3.57 | 4.32 | 1.49 |
| Creatinine | CLIA 2025 10% or | 10 | 9.25 | 8.81 | 0.09 |
| Creatinine | 0.2 mg/dL | 10 | 9.25 | 6.17 | 0.12 |
| Glucose | CLIA 2025 8% or | 8 | 6.26 | 3.12 | 0.56 |
| Glucose | 6 mg/dL | 8 | 6.26 | 2.89 | 0.60 |
| HDL | 6 mg/dl or 20% | 20 | 6.31 | 6.96 | 1.97 |
| HDL | 6 mg/dl or 20% | 20 | 6.31 | 5.95 | 2.30 |
| Magnesium | CLIA 2025 | 15 | 12.29 | 8.45 | 0.32 |
| Magnesium | 15% | 15 | 12.29 | 6.98 | 0.39 |
| Protein, Total | CLIA 2025 | 8 | 10 | 2.43 | negative |
| Protein, Total | 8% | 8 | 10 | 2.26 | negative |
| Triglycerides | CLIA 2025 | 15 | 10.46 | 4.21 | 1.08 |
| Triglycerides | 15% | 15 | 10.46 | 4.64 | 0.98 |
| Urea Nitrogen | CLIA 2025 | 9 | 8.6 | 3.8 | 0.11 |
| Urea Nitrogen | 2.0 mg/dL or 9% | 9 | 8.6 | 3.81 | 0.10 |
| Uric Acid | CLIA 2025 | 10 | 4.56 | 3.34 | 1.63 |
| Uric Acid | 10% | 10 | 4.56 | 4.61 | 1.18 |
Seeing these numbers, it is no longer that relevant whether or not the controls are from the manufacturer or not. These are not good numbers, so if this is the most optimistic the metrics can get, it's not good enough. The reader will undoubtedly note where the table indicates negative Sigma. This simply means that the bias exceeds the allowable total error. At that point, a Sigma metric is not useful, because the method is simply missing the target completely. If the bias could be corrected or reduced, the Sigma metric could be calculated then.
One can't help but notice there are no instances of 6 Sigma methods, or 5 Sigma methods, and only 1 method reaches 4 Sigma.
Graphic illustration of analytical performance by NMEDx chart
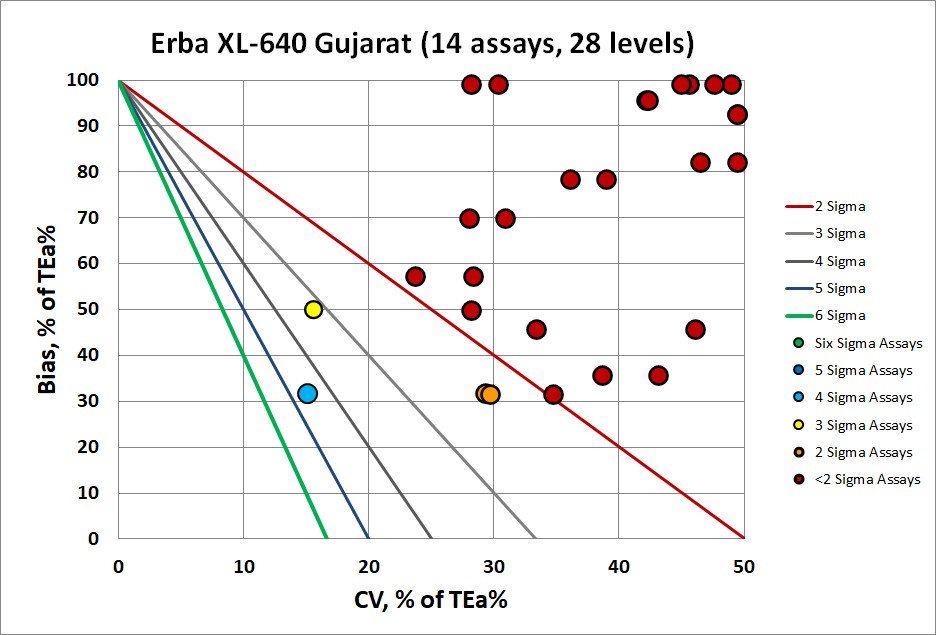
This is not a good look. It's one of the worst we've ever seen. The vast majority of the methods here are below 2 Sigma. Many of them are "off the chart", with excessive bias (those are the "negative sigma" assays), and a few also have excessive imprecision. Essentially all of these methods need improvement, full Westgard Rules, plus any other kind of statistical or non-statistical monitoring that could be implemented.
Conclusion
This is not the first analysis that has revealed performance challenges on the Erba analyzer. An analysis of the Erba 360 is also here. The Erba is an analyzer from India, primarily used within India (we presume), so it may not be helpful to apply CLIA 2025 analytical goals to the instrument. But there are no existing Indian analytical goals. If we were to apply EFLM biological variation based goals, the results might be even worse. A troubling question arises: should Indian analyzers in Indian hospitals be judged by a set of less demanding standards? Are resource-challenged countries to be assessed by lower standards? The argument could be made that it is unrealistic to expect "first world" performance of an instrument in a "developing world" region. But that also implies that if lower quality is acceptable, the healthcare decisions and care delivery is of a similar lower quality.
If we accept the judgment of the CLIA 2025 goals, the use of the instrument, if there is no alternative or impovement possible, should be handled with extreme care. Results from the instrument should be carefully evaluated within the clinical context of the patient. Reference Change Values (RCV, also sometimes called Critical Difference) would be helpful in sorting out the noise of the system from the signal of patient. The lab and the clinician should be aware of the fact that results will be obscured by the poor quality of the instrument.