Sigma Metric Analysis
An Erba XL-640 in West Bengal, India
A new study of the Erba XL-640 in West Bengal has stellar results. Can they be trusted?
An Erba XL-640 in West Bengal, India
June 2026
Sten Westgard, MS
[Sigma score: long-term imprecision: +0.5; controls near decision points: +0.5; Final Score: 1. Possibly Misleading. ]
A recent study looked at the Erba XL-640 performance at an Indian laboratory in West Bengal:
Quantification of Uncertainty of Common Laboratory Parameters in a Clinical Laboratory in a Tertiary Care Institute, Chatterjee S., Singha S., Ghosh A., Ghosh S. International Journal of Current Pharmaceutical Review and Research 2026; 18(6): 874-879.
We have analyzed Erba instruments before on Westgard Web, here and here, this latest paper gives us one more look at the instruments. This one, however, has a lot of issues with it. I have reached out to the authors to ask them several questions, but so far, no answers have been given. The email for corresponding author was not even included in the paper.
I don't pick on these authors for sport. I look for papers that cover the topic of analytical Sigma metrics, and this paper came to my attention moments after I finished assessing another paper that covered the Erba XL-640. So that topicality drew me to it. Then I realized that there were some significant flaws in study.
First, as the title notes, it is ostensibly supposed to discuss measurement uncertainty. In fact, the study calculates analytical Sigma metrics, not measurement uncertainty at all. Perhaps the title was a mistake.
Next, I noticed that the equation for bias was printed as follows: Bias% = (Lab Mean - Target Mean ) X 100. Missing a key term there, aren't they? If they truly used that as their equation for bias%, they would get very large numbers, since they would be unit differences multiplied a hundredfold. Strangely, the resulting calculations for bias% presented in the study are actually mostly below 1%, with two biases at around 1.2%. That is even more mysterious, probably indicating that the actual calculations of bias in the paper were not done following the equation listed in the paper.
Finally, and more fundamentally, the paper confuses TE with TEa. Analytical total error (TE) is not the same as allowable total error (TEa). Total error (TE) is something you calculate from the observed performance, and then you compare it with the allowable total error (TEa) to see if it's acceptable. This is the approach introduced by "the" Westgard back in the 1970s and 1980s, long before the Six Sigma standard. In this paper, unfortunately, the authors confuse TE with TEa, and they calculate TE and treat it as TEa for the calculation of analytical Sigma metrics. Thus, all the analytical Sigma metric calculations in the paper are wrong. TEa goals are not calculated from the observed performance of a single laboratory. They must be determined some other way. Most commonly, TEa goals are given to the laboratory from an external source, like the CLIA regulations for proficiency testing (PT), or the Rilibaek rules, or the RCPA ALPs for external quality assessment (EQA), or the biological variation quality requirements from the EFLM biological variation database.
We're going to try and salvage some of this performance data and apply the CLIA 2025 quality goals to see what the analytical Sigma metrics could be.
Calculating Sigma metrics from routine laboratory performance data.
The imprecision and bias of the analyzers
"QC data for 6 months both L1 and L2 were considered as sample size. Minimum for robust analysis in tertiary care hospital: > 60. For 6 months study for each analyte and each control level: Daily IQC once per day X 144 working = 144 result for each level... So for L1: 144 samples and L2: 144 samples were oconsidered as final sample sizes." The controls were from Erba, with NORM and PATH levels. Not ideal, since 3rd party controls are considered best practice.
The source of the bias calculation was probably taken as the difference between the "Laboratory mean & Peer group mean." Again, if the results are all lower than 1.2%, however, that, coupled with the error in the stated equation, raises suspicion about the actual bias values.
The study mistakenly used calculated TE for the TEa. If you calculate Sigma metrics from TE, you'll get numbers that are not useful. Here, we correct the calculations with the use of the CLIA 2025 goals for most of the assays (for direct bilirubin we use an Ricos 2014 goal).
| Erba XL-640 West Bengal Test | TEa Source | TEa | Lab Mean | % Bias | % CV | Sigma |
| Albumin | CLIA 2025 | 8 | 3.52 | 0.18 | 0.91 | 8.6 |
| Albumin | 8% | 8 | 4.8 | 0.14 | 0.86 | 9.1 |
| Alk Phos | CLIA 2025 | 20 | 117.68 | 0.13 | 2.30 | 8.6 |
| Alk Phos | 20% | 20 | 379.1 | 0.11 | 1.80 | 11.1 |
| ALT | CLIA 2025 | 15 | 45.48 | 0.32 | 0.95 | 15.5 |
| ALT | 6 U/L or 15.0 | 15 | 161.2 | 0.38 | 0.97 | 15.1 |
| AST | CLIA 2025 | 15 | 40.8 | 0.13 | 1.90 | 7.8 |
| AST | 6 U/L or 15.0 | 15 | 141.3 | 0.11 | 1.40 | 10.6 |
| Bilirubin, Direct | Ricos 2014 Desirable | 44.5 | 0.9 | 1.11 | 1.11 | 39.1 |
| Bilirubin, Direct | 44.50% | 44.5 | 1.7 | 1.19 | 1.14 | 38.0 |
| Bilirubin, Total | CLIA 2025 | 20 | 4.5 | 0.13 | 2.14 | 9.3 |
| Bilirubin, Total | 0.4 mg/dL (5.13 umol/L) or 20% | 25.3 | 1.58 | 0.17 | 2.27 | 11.1 |
| Cholesterol | CLIA 2025 | 10 | 140.2 | 0.22 | 1.80 | 5.4 |
| Cholesterol | 10% | 10 | 247.1 | 0.25 | 1.12 | 8.7 |
| Creatinine | CLIA 2025 | 10 | 3.56 | 0.48 | 2.15 | 4.4 |
| Creatinine | 0.2 mg/dL or 10% | 18.9 | 1.06 | 0.41 | 2.13 | 8.7 |
| Glucose | CLIA 2025 | 8 | 272.25 | 0.16 | 1.97 | 4.0 |
| Glucose | 6 mg/dL or 8% | 8 | 104.86 | 0.14 | 1.99 | 3.9 |
| HDL | CLIA 2025 | 20 | 38.28 | 0.12 | 1.80 | 11.0 |
| HDL | 6 mg/dl or 20% | 20 | 64.1 | 0.09 | 1.30 | 15.3 |
| LDL | CLIA 2025 | 20 | 80.88 | 0.51 | 1.40 | 13.9 |
| LDL | 20% | 20 | 124.1 | 0.47 | 1.20 | 16.3 |
| Protein, Total | CLIA 2025 | 8 | 6.14 | 0.52 | 1.40 | 5.3 |
| Protein, Total | 8% | 8 | 9.1 | 0.42 | 1.30 | 5.8 |
| Triglycerides | CLIA 2025 | 15 | 129.08 | 0.91 | 2.15 | 6.6 |
| Triglycerides | 15% | 15 | 206.4 | 0.78 | 1.96 | 7.3 |
| Urea Nitrogen | CLIA 2025 | 9 | 104.91 | 0.38 | 1.98 | 4.4 |
| Urea Nitrogen | 2.0 mg/dL or 9% | 9 | 33.27 | 0.44 | 2.05 | 4.2 |
Most of these numbers are great. The majority of the performance is world class. When we look at the graphic illustration, it gives an even better impression.
Graphic illustration of analytical performance by NMEDx chart
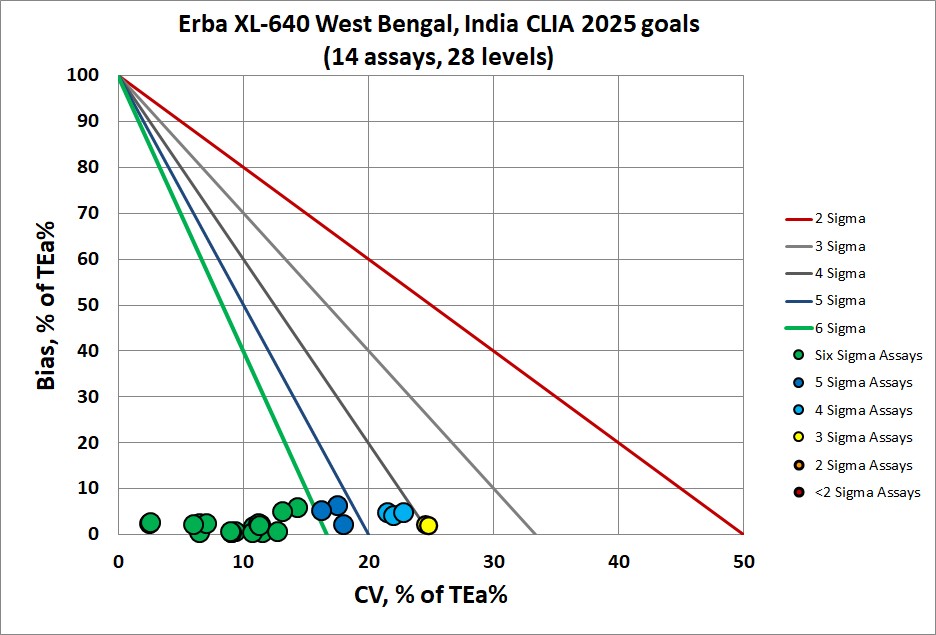
If we could trust this data, it would be a great look. A massive contrast from the study we see in Gujarat, India. Bias is extremely small, nearly zero, for all methods, and imprecision is equally impressive. It's such a contrast from the other XL-640 study, that one wonders if both can be true. Is one lab doing it all wrong, and the other doing it all right?
Conclusion
The authors concluded, "Some parameters of both L1 and L2 control levels measured by daily control runs in the given time frame showed unacceptable performances some some [stet.] parameters showed marginal performance. The causes of these types of performances were due to random errors and can be corrected by daily maintenance of the instrument, robust quality control practices, regular training of the all level [stet.] of staffs and strict adherence to the SOPs." Actually, of course, the real cause of the low Sigma metrics was the use of the wrong quality goals, TE being mistakenly used as TEa.
If one uses the CV and bias data but correctly applies the Sigma metric equation, using TEa goals from mostly CLIA 2025, there are very happy numbers in this study. But there are reasons to distrust the data. There are other analyses which converge on a far worse verdict on Erba analyzer quality. An analysis of the Erba 360 is also here. True, the applicability of CLIA 2025 goals may be open to question. Should there be more lenient goals used in India? Currently there are no existing Indian analytical goals (if you know of some, please contact us).
The weight of evidence and examples points toward an unfavorable assessment of Erba XL-640 analytical quality, but if other labs can provide similar data as above, we are open to changing this verdict. Given the signficant mistakes in the paper, it's wise to greet the data and conclusions here with skepticism.