Sigma Metric Analysis
A Roche Cobas c501 in Vietnam, corrected
A recent study looked at the analytical performance of a Roche cobas c501 at Phuc Hung General Hospital, Vietnam. Unfortunately, they made a mistake in their calculations. We provide the corrections here.
A cobas c501 in Vietnam, with corrected calculations
January 2026
Sten Westgard, MS
A recent study from the Phuc Hung General Hospital, Quang Ngai, Vietnam, evaluated the performance of biochemistry assays on a cobas c501:
Six Sigma in the evaluation of qualit indicators using Roche Cobas c501 biochemistry analyzer, Vu Dinh Pham, Journal of Laboratory Physicians. doi: 10.25259/JLP_285_2025
Calculating Sigma metrics from routine laboratory performance data.
An unfortunate problem with some studies is that they don't use the absolute value of the bias. That is, they use the sign of the bias. In the cases of negative bias, this means that the TEa - bias can end up creating a larger TEa ( TEa - (bias) = TEa + bias ). In early descriptions of the Sigma metric equation, there were verbal instructions that the bias had to be absolute, but the equation didn't use the |bias| signs. So if you were looking only at the equation without reading the description, you might miss the need for an absolute bias.
The imprecision and bias of the analyzers:
As is often the case with cobas, the QC being run was from the manufacturer, which is not ideal. If anything, that means the imprecision estimates here might be optimistic. "IQC samples were PreciControl ClinChem (PCCC) Multi1 and 2.... EQA samples from Randox Laboratories...analyzed monthly as part of the EQA program coordinated by the Centre for External Quality Control in Medical Laboratory Testing... Ho Chi Minh City."
The study applied the CLIA 2025 performance goals, but not exactly. For some assays where CLIA 2025 has a unit based goal on the lower end, the study did not calculate that and instead used the fixed percentage goal from the upper end. In our analysis, we attempted to estimate the goal at the lower when calculating the Sigma metric. And in some cases, an goal without a source was applied. The study used a 30% goal for calcium, while for CLIA 2025, the unit-based goal would range from 9% to 18%.
| Analyte | CV | Bias | Study Sigma | Corrected Sigma | Change |
| Albumin | 4.28 | -5.91 | 3.3 | 0.5 | -85% |
| Albumin | 3.22 | -1.99 | 3.1 | 1.9 | -39.8% |
| ALT* (low TEa estimated) | 4.58 | -2.44 | 3.8 | 6 | increased |
| ALT | 5.27 | -7.29 | 1.5 | 1.5 | same |
| Amylase (TEa too small in study) | 2.99 | -0.13 | 3.4 | 6 | increased |
| Amylase (TEa too small in study) | 3.02 | -0.14 | 3.4 | 6 | increased |
| AST* (low TEa estimated) | 4.15 | 2.43 | 3.0 | 6 | increased |
| AST | 3.02 | 5.78 | 3.1 | 3.1 | same |
| Bilirubin, Direct (TEa is too small in study, used Ricos 2014 goal) | 8.03 | -0.11 | 2.5 | 5.5 | increased |
| Bilirubin, Direct (TEa is too small in study, used Ricos 2014 goal) | 8.19 | -3.18 | 2.8 | 5.0 | increased |
| Bilirubin, Total* (low TEa estimated) | 6.2 | -0.4 | 3.3 | 6 | increased |
| Bilirubin, Total | 6.24 | -3.51 | 3.8 | 2.6 | -29.9% |
| Calcium* (low TEa estimated) | 6.8 | -3.55 | 4.9 | 2.1 | -56.9% |
| Calcium* (high TEa estimated) | 2.52 | -0.7 | 6 | 3.3 | -73% |
| Cholesterol | 3.24 | -8.57 | 5.7 | 0.4 | -92.3% |
| Cholesterol | 2.57 | -3.07 | 5.1 | 2.7 | -47% |
| Creatinine Kinase (CK) | 2.56 | -3.65 | 6 | 6 | -30.9% |
| Creatinine Kinase (CK) | 1.29 | -9.22 | 6 | 6 | -63.1% |
| Creatinine* (low TEa estimated) | 4.05 | -3.54 | 3.3 | 4.1 | increased |
| Creatinine | 3.92 | -3.32 | 3.4 | 1.7 | -49.9% |
| GGT | 3.63 | 1.96 | 3.6 | 3.6 | same |
| GGT | 3.87 | -0.77 | 4.1 | 3.7 | -9.7% |
| Glucose* (low TEa estimated) | 2.05 | 0.18 | 3.8 | 7.7 | increased |
| Glucose | 2.9 | -2.91 | 3.8 | 1.8 | -53.3% |
| HDL | 6.01 | 1.3 | 3.1 | 3.1 | same |
| HDL | 5.79 | -0.51 | 3.5 | 3.4 | -4.9% |
| Iron | 9.25 | 3.72 | 1.2 | 1.2 | same |
| Iron | 8.31 | -2.26 | 2.1 | 1.5 | -26.3% |
| Protein, Total | 2.55 | -0.43 | 3.3 | 3.0 | -10.3% |
| Protein, Total | 2.87 | -1.58 | 3.3 | 2.2 | -33% |
| Triglycerides | 3.01 | -0.77 | 5.2 | 4.7 | -9.8% |
| Triglycerides | 3.06 | -3.27 | 6 | 3.5 | -45.1% |
| Urea Nitrogen* (low TEa estimated) | 6.63 | -7.92 | 2.6 | 1.1 | -58.1% |
| Urea Nitrogen | 5.47 | -4.79 | 2.5 | 0.8 | -69.5% |
| Uric Acid | 4.01 | -3.27 | 3.3 | 1.7 | -49.3% |
| Uric Acid | 3.82 | -1.76 | 3.1 | 2.2 | -30% |
Not all of the assays here got worse. In a few cases, because of a change in the TEa, the Sigma metrics actually went up. But overall, whenever there was a negative bias, that increased the study metric incorrectly. The corrections bring the metrics back down to earth. There are very large differences between the study's calculations and the corrected one.s
Graphic Display of performance by Normalized Method Decision Chart (NMEDx)
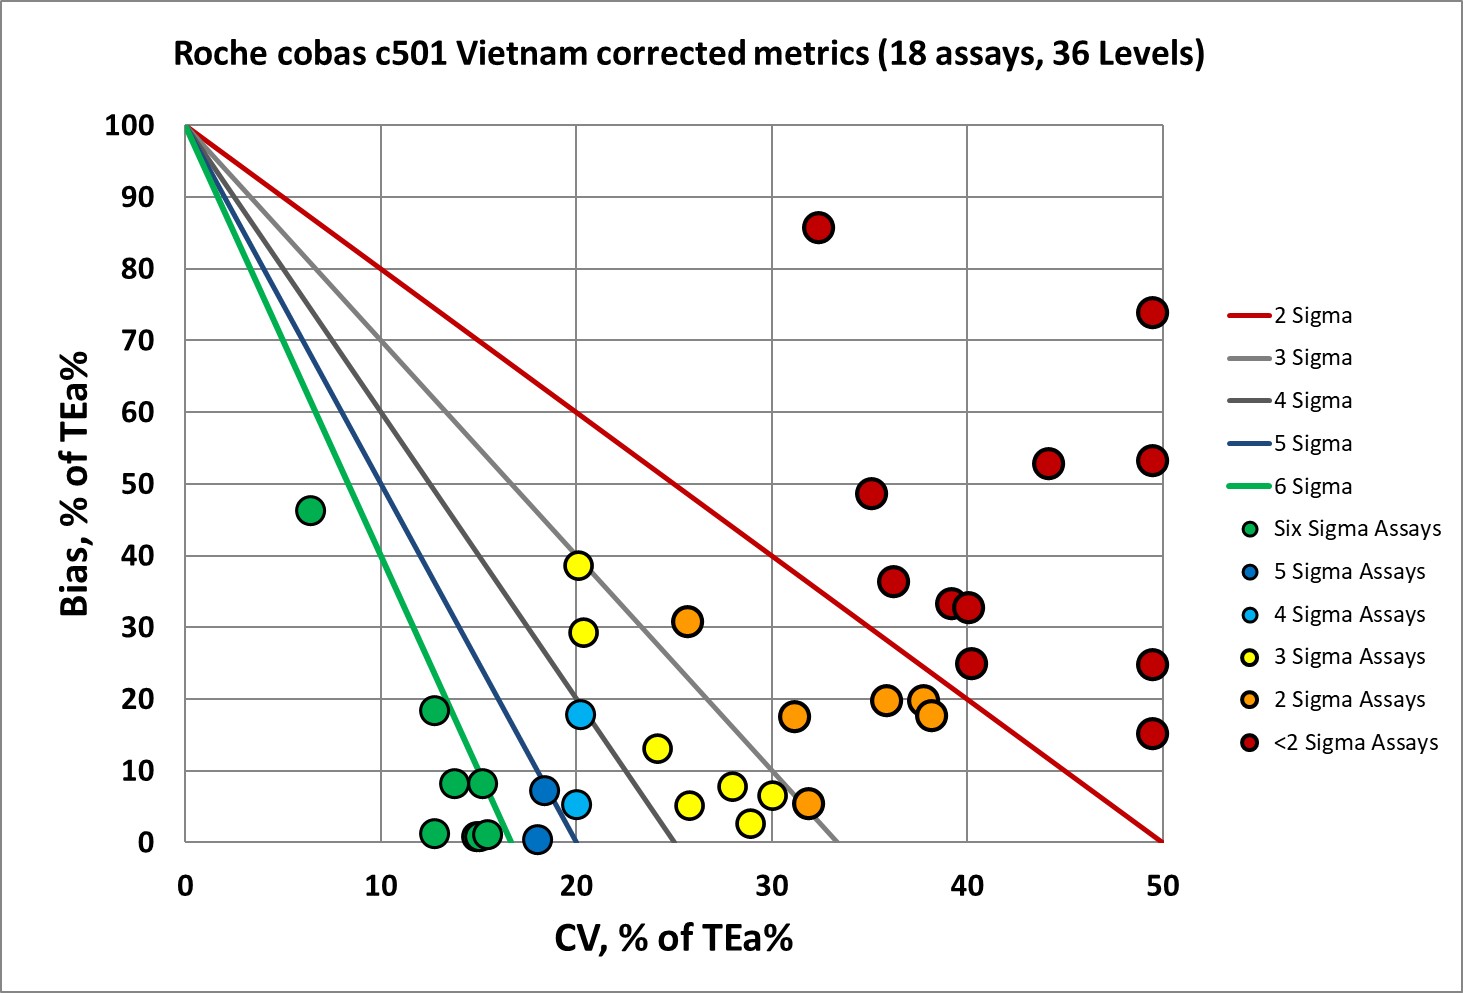
Only a third of this performance is 4, 5, or 6 Sigma. Two-thirds of the performance is the bare minimum of 3 Sigma or worse. This is an instrument where nearly every method needs the full Westgard Rules.
Conclusion
We can see how incorrect calculations may give a false impression of performance. But also we see that the cobas c501, while enjoying a global reputation and popularity, in some circumstances is not all that good. The original study found "15 out of 18 tests achieved Sigma levels of three or higher at both concentration levels." The reality is that this instrument was performing far worse.