Sigma Metric Analysis
Multimode analysis of an Atellica CH930 in Romania
It's time to take another look at a major instrument system, and apply Sigma metrics using goals from the most popular sources, CLIA, Ricos 2014, and EFLM 2022.
Multimode analysis of an Atellica CH 930 chemistry analyzer in Romania
March 2022, updated July 2022, updated April 2023
Sten Westgard, MS
A few years ago, we took a look at the Siemens Atellica. It's time to look again, using the latest performance specifications from the EFLM, Ricos 2014, and CLIA 1992. June 2022: updated to assess new EFLM biological minimum goals. April 2023: updated to assess new CLIA 2024 goals
See the other analyses in this series:
- Beckman Coulter DxC 700
- Abbott Alinity
- Siemens Atellica
- Siemens Atellica in Romania
- Siemens Atellica in Spain
- Siemens ADVIA 2120i
- Roche c501 in Turkey
- Roche c501 in Saudi Arabia
- MicroLab RX-50 in India
- Roche cobas 6000 immunoassays in Turkey
- Sysmex XN 350 in India
- Mindray 7500 in China
- Mindray BS 2000M in China
This latest set of data comes from a very thorough study from Revista Romana de Medicina de Laborator, Vol. 29 Nr. 4, October 2021:
The study was conducted between April and June 2020 at the Central Laboratory of Targu Mures County Emergency Clinical Hospital in Romania. Daily QC was recorded for over 30 days, using 3 levels of Bio-Rad controls. They compared the new Atellica with the laboratory's then-current method, the Roche Cobas 6000 c501. "Analytical difference... between test and comparative methods was calculated at medical decision levels (MDL) based on Passing-Bablock regression equations." The study actually calculated the biases between the Atellica and the Architect and the Atellica and the Cobas; for our purposes we are going to use the bias between Cobas and Atellica, since Roche instruments are more widespread.
The raw data of imprecision and bias
| Test | % Bias | % CV |
| Albumin | 12.40 | 2.16 |
| Albumin | 6.60 | 1.52 |
| Albumin | 4.10 | 1.43 |
| Alk Phos | 1.40 | 2.25 |
| Alk Phos | 1.80 | 1.72 |
| ALT | 10.40 | 3.05 |
| ALT | 12.40 | 2.72 |
| Amylase | 7.00 | 1.62 |
| Amylase | 6.50 | 1.66 |
| AST | 11.20 | 2.98 |
| AST | 12.20 | 4.13 |
| Bilirubin, Direct | 2.60 | 7.75 |
| Bilirubin, Direct | 2.90 | 5.75 |
| Bilirubin, Direct | 3.20 | 5.75 |
| Bilirubin, Total | 12.10 | 0.10 |
| Bilirubin, Total | 12.10 | 5.03 |
| Bilirubin, Total | 12.10 | 4.47 |
| Calcium | 5.40 | 3.57 |
| Calcium | 2.50 | 3.04 |
| Calcium | 1.60 | 2.25 |
| Cholesterol | 2.70 | 1.42 |
| Cholesterol | 2.20 | 1.34 |
| Creatinine Kinase (CK) | 1.70 | 2.51 |
| Creatinine Kinase (CK) | 1.40 | 2.16 |
| Creatinine | 0.30 | 4.29 |
| Creatinine | 0.70 | 3.55 |
| GGT | 8.50 | 5.68 |
| GGT | 7.00 | 4.11 |
| Glucose | 1.00 | 2.15 |
| Glucose | 0.40 | 1.92 |
| Glucose | 0.70 | 1.92 |
| Iron | 2.50 | 9.90 |
| Iron | 3.00 | 3.68 |
| Iron | 3.70 | 3.68 |
| LDH | 5.00 | 2.73 |
| LDH | 4.00 | 2.20 |
| Magnesium | 3.90 | 4.39 |
| Magnesium | 3.20 | 3.08 |
| Magnesium | 2.60 | 2.03 |
| Potassium | 3.00 | 0.92 |
| Potassium | 2.90 | 0.58 |
| Potassium | 2.80 | 0.70 |
| Protein, Total | 3.00 | 0.88 |
| Protein, Total | 4.00 | 0.76 |
| Protein, Total | 4.70 | 0.79 |
| Sodium | 1.70 | 0.71 |
| Sodium | 1.50 | 0.57 |
| Sodium | 1.30 | 0.57 |
| Triglycerides | 2.30 | 2.49 |
| Triglycerides | 1.60 | 1.77 |
| Urea Nitrogen | 11.40 | 2.57 |
| Urea Nitrogen | 9.70 | 2.57 |
| Uric Acid | 8.50 | 3.34 |
| Uric Acid | 8.60 | 3.26 |
There are 22 test methods that they analyzed, in some cases they only focused on 2 levels, in other cases, 3 levels. Now, the next thing to do is take a look at the latest (2022) EFLM performance specifications, as derived from the EuBIVAS biological variation database; Ricos 2014 performance specifications; and finally the 1992 CLIA goals.
Please note that the number of assays will vary from table to table, since not all assays are covered by the latest EuBIVAS database, Ricos goals, or the CLIA goals. That makes the comparison slightly uneven - but it's a comparison of slightly different sizes of apples, not entirely different fruits.
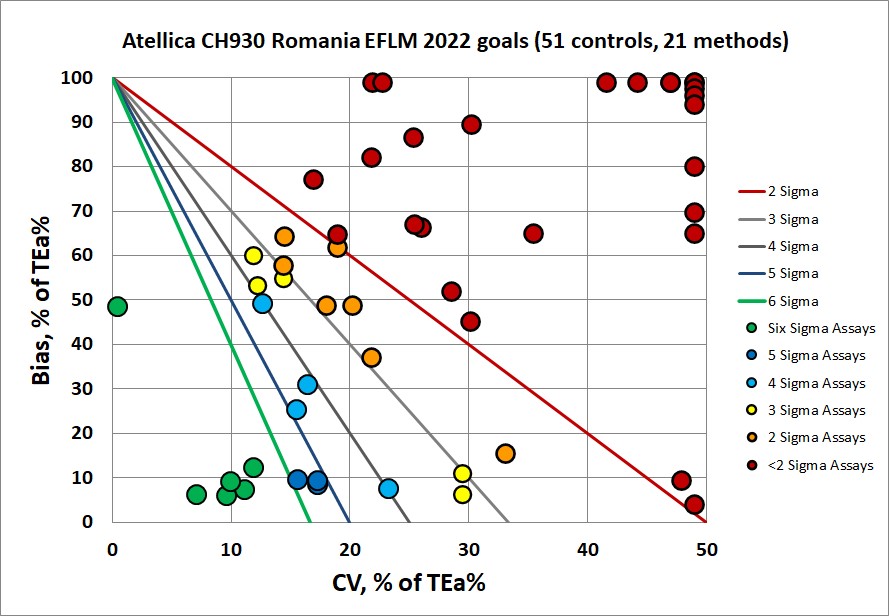
Sigma-metrics according to EuBIVAS-derived desirable performance specifications (as of January 2022)
If you're looking for the toughest set of specifications, EFLM gives them. More than half of the assay performance is located at 3 Sigma and below, while just over a third of performance is at 6 Sigma. That's the most worst and the least best in our comparison.
| Test | TEa | % Bias | % CV | Sigma metric |
| Albumin | 3.44 | 12.40 | 2.16 | negative |
| Albumin | 3.44 | 6.60 | 1.52 | negative |
| Albumin | 3.44 | 4.10 | 1.43 | negative |
| Alk Phos | 14.5 | 1.40 | 2.25 | 5.8 |
| Alk Phos | 14.5 | 1.80 | 1.72 | >6 |
| ALT | 16.08 | 10.40 | 3.05 | 1.9 |
| ALT | 16.08 | 12.40 | 2.72 | 1.4 |
| Amylase | 13.17 | 7.00 | 1.62 | 3.8 |
| Amylase | 13.17 | 6.50 | 1.66 | 4.0 |
| AST | 13.65 | 11.20 | 2.98 | 0.8 |
| AST | 13.65 | 12.20 | 4.13 | 0.4 |
| Bilirubin, Direct | 33.40 | 2.60 | 7.75 | 4.0 |
| Bilirubin, Direct | 33.40 | 2.90 | 5.75 | 5.3 |
| Bilirubin, Direct | 33.40 | 3.20 | 5.75 | 5.3 |
| Bilirubin, Total | 24.84 | 12.10 | 0.10 | >6 |
| Bilirubin, Total | 24.84 | 12.10 | 5.03 | 2.5 |
| Bilirubin, Total | 24.84 | 12.10 | 4.47 | 2.9 |
| Calcium | 2.30 | 5.40 | 3.57 | negative |
| Calcium | 2.30 | 2.50 | 3.04 | negative |
| Calcium | 2.30 | 1.60 | 2.25 | 0.3 |
| Cholesterol | 8.66 | 2.70 | 1.42 | 4.2 |
| Cholesterol | 8.66 | 2.20 | 1.34 | 4.8 |
| Creatinine Kinase (CK) | 22.57 | 1.70 | 2.51 | >6 |
| Creatinine Kinase (CK) | 22.57 | 1.40 | 2.16 | >6 |
| Creatinine | 7.41 | 0.30 | 4.29 | 1.7 |
| Creatinine | 7.41 | 0.70 | 3.55 | 1.9 |
| GGT | 18.86 | 8.50 | 5.68 | 1.8 |
| GGT | 18.86 | 7.00 | 4.11 | 2.9 |
| Glucose | 6.50 | 1.00 | 2.15 | 2.6 |
| Glucose | 6.50 | 0.40 | 1.92 | 3.2 |
| Glucose | 6.50 | 0.70 | 1.92 | 3.0 |
| LDH | 7.70 | 5.00 | 2.73 | 1.0 |
| LDH | 7.70 | 4.00 | 2.20 | 1.7 |
| Magnesium | 4.00 | 3.90 | 4.39 | 0.0 |
| Magnesium | 4.00 | 3.20 | 3.08 | 0.3 |
| Magnesium | 4.00 | 2.60 | 2.03 | 0.7 |
| Potassium | 4.85 | 3.00 | 0.92 | 2.0 |
| Potassium | 4.85 | 2.90 | 0.58 | 3.4 |
| Potassium | 4.85 | 2.80 | 0.70 | 2.9 |
| Protein, Total | 3.47 | 3.00 | 0.88 | 0.5 |
| Protein, Total | 3.47 | 4.00 | 0.76 | negative |
| Protein, Total | 3.47 | 4.70 | 0.79 | negative |
| Sodium | 0.69 | 1.70 | 0.71 | negative |
| Sodium | 0.69 | 1.50 | 0.57 | negative |
| Sodium | 0.69 | 1.30 | 0.57 | negative |
| Triglycerides | 25.04 | 2.30 | 2.49 | >6 |
| Triglycerides | 25.04 | 1.60 | 1.77 | >6 |
| Urea Nitrogen | 17.76 | 11.40 | 2.57 | 2.5 |
| Urea Nitrogen | 17.76 | 9.70 | 2.57 | 3.1 |
| Uric Acid | 12.82 | 8.50 | 3.34 | 1.3 |
| Uric Acid | 12.82 | 8.60 | 3.26 | 1.3 |
The news here is grim. We have a lot of very low Sigma metrics, 64% of the values are below 3, and in many cases the bias is larger than the goal (resulting in what we can "negative" Sigma). Only a little over 11% of the values are bove 6 Sigma.
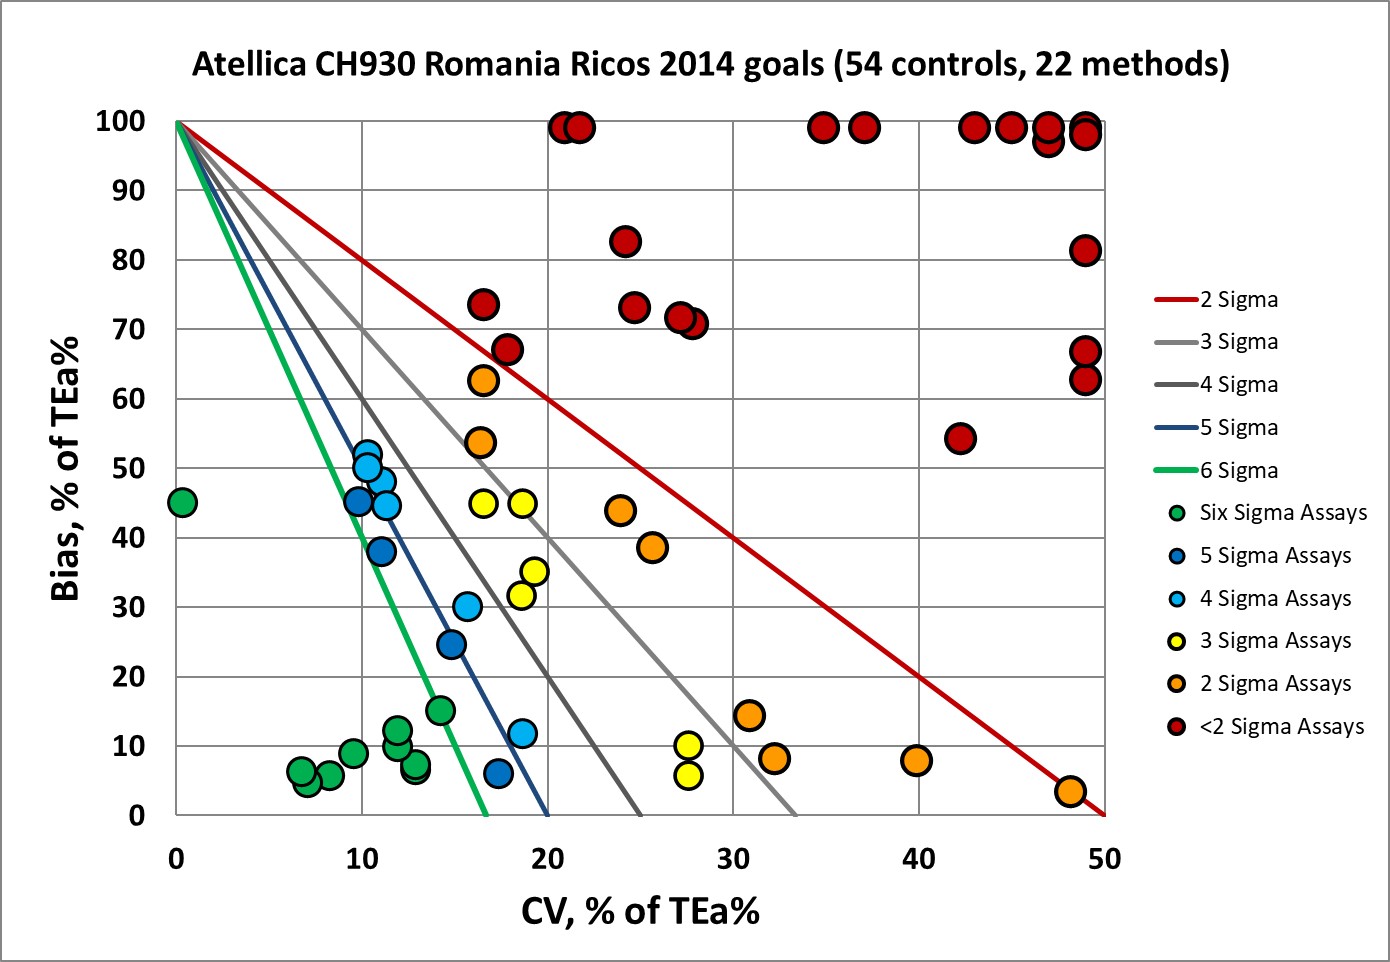
Next, we can look at the "original" version of the biological variation database. The last version of the database was updated in 2014 by Ricos et al, so we refer to these performance specifications as Ricos 2014 goals.
Sigma-metrics according to Ricos 2014 desirable performance specifications
The original Ricos goals are not quite as hard on this Atellica. Over 53% of the values are still below 3 Sigma, and now 16% of the values are above 6 Sigma. But that is still not a good look.
| Test | % TEa | % Bias | % CV | Sigma metric |
| Albumin | 4.1 | 12.40 | 2.16 | negative |
| Albumin | 4.1 | 6.60 | 1.52 | negative |
| Albumin | 4.1 | 4.10 | 1.43 | 0.0 |
| Alk Phos | 12.04 | 1.40 | 2.25 | 4.7 |
| Alk Phos | 12.04 | 1.80 | 1.72 | 6.0 |
| ALT | 27.5 | 10.40 | 3.05 | 5.6 |
| ALT | 27.5 | 12.40 | 2.72 | 5.6 |
| Amylase | 14.6 | 7.00 | 1.62 | 4.7 |
| Amylase | 14.6 | 6.50 | 1.66 | 4.9 |
| AST | 16.7 | 11.20 | 2.98 | 1.8 |
| AST | 16.7 | 12.20 | 4.13 | 1.1 |
| Bilirubin, Direct | 44.50 | 2.60 | 7.75 | 5.4 |
| Bilirubin, Direct | 44.50 | 2.90 | 5.75 | >6 |
| Bilirubin, Direct | 44.50 | 3.20 | 5.75 | >6 |
| Bilirubin, Total | 26.94 | 12.10 | 0.10 | >6 |
| Bilirubin, Total | 26.94 | 12.10 | 5.03 | 3.0 |
| Bilirubin, Total | 26.94 | 12.10 | 4.47 | 3.3 |
| Calcium | 2.55 | 5.40 | 3.57 | negative |
| Calcium | 2.55 | 2.50 | 3.04 | 0.0 |
| Calcium | 2.55 | 1.60 | 2.25 | 0.4 |
| Cholesterol | 9.01 | 2.70 | 1.42 | 4.4 |
| Cholesterol | 9.01 | 2.20 | 1.34 | 5.1 |
| Creatinine Kinase (CK) | 30.30 | 1.70 | 2.51 | >6 |
| Creatinine Kinase (CK) | 30.30 | 1.40 | 2.16 | >6 |
| Creatinine | 8.90 | 0.30 | 4.29 | 2.0 |
| Creatinine | 8.90 | 0.70 | 3.55 | 2.3 |
| GGT | 22.10 | 8.50 | 5.68 | 2.4 |
| GGT | 22.10 | 7.00 | 4.11 | 3.7 |
| Glucose | 6.96 | 1.00 | 2.15 | 2.8 |
| Glucose | 6.96 | 0.40 | 1.92 | 3.4 |
| Glucose | 6.96 | 0.70 | 1.92 | 3.3 |
| Iron | 30.70 | 2.50 | 9.90 | 2.8 |
| Iron | 30.70 | 3.00 | 3.68 | >6 |
| Iron | 30.70 | 3.70 | 3.68 | >6 |
| LDH | 11.40 | 5.00 | 2.73 | 2.3 |
| LDH | 11.40 | 4.00 | 2.20 | 3.4 |
| Magnesium | 4.80 | 3.90 | 4.39 | 0.2 |
| Magnesium | 4.80 | 3.20 | 3.08 | 0.5 |
| Magnesium | 4.80 | 2.60 | 2.03 | 1.1 |
| Potassium | 5.6 | 3.00 | 0.92 | 2.8 |
| Potassium | 5.6 | 2.90 | 0.58 | 4.7 |
| Potassium | 5.6 | 2.80 | 0.70 | 4.0 |
| Protein, Total | 3.63 | 3.00 | 0.88 | 0.7 |
| Protein, Total | 3.63 | 4.00 | 0.76 | negative |
| Protein, Total | 3.63 | 4.70 | 0.79 | negative |
| Sodium | 0.7 | 1.70 | 0.71 | negative |
| Sodium | 0.7 | 1.50 | 0.57 | negative |
| Sodium | 0.7 | 1.30 | 0.57 | negative |
| Triglycerides | 25.99 | 2.30 | 2.49 | >6 |
| Triglycerides | 25.99 | 1.60 | 1.77 | >6 |
| Urea Nitrogen | 15.50 | 11.40 | 2.57 | 1.6 |
| Urea Nitrogen | 15.50 | 9.70 | 2.57 | 2.3 |
| Uric Acid | 12.00 | 8.50 | 3.34 | 1.0 |
| Uric Acid | 12.00 | 8.60 | 3.26 | 1.0 |
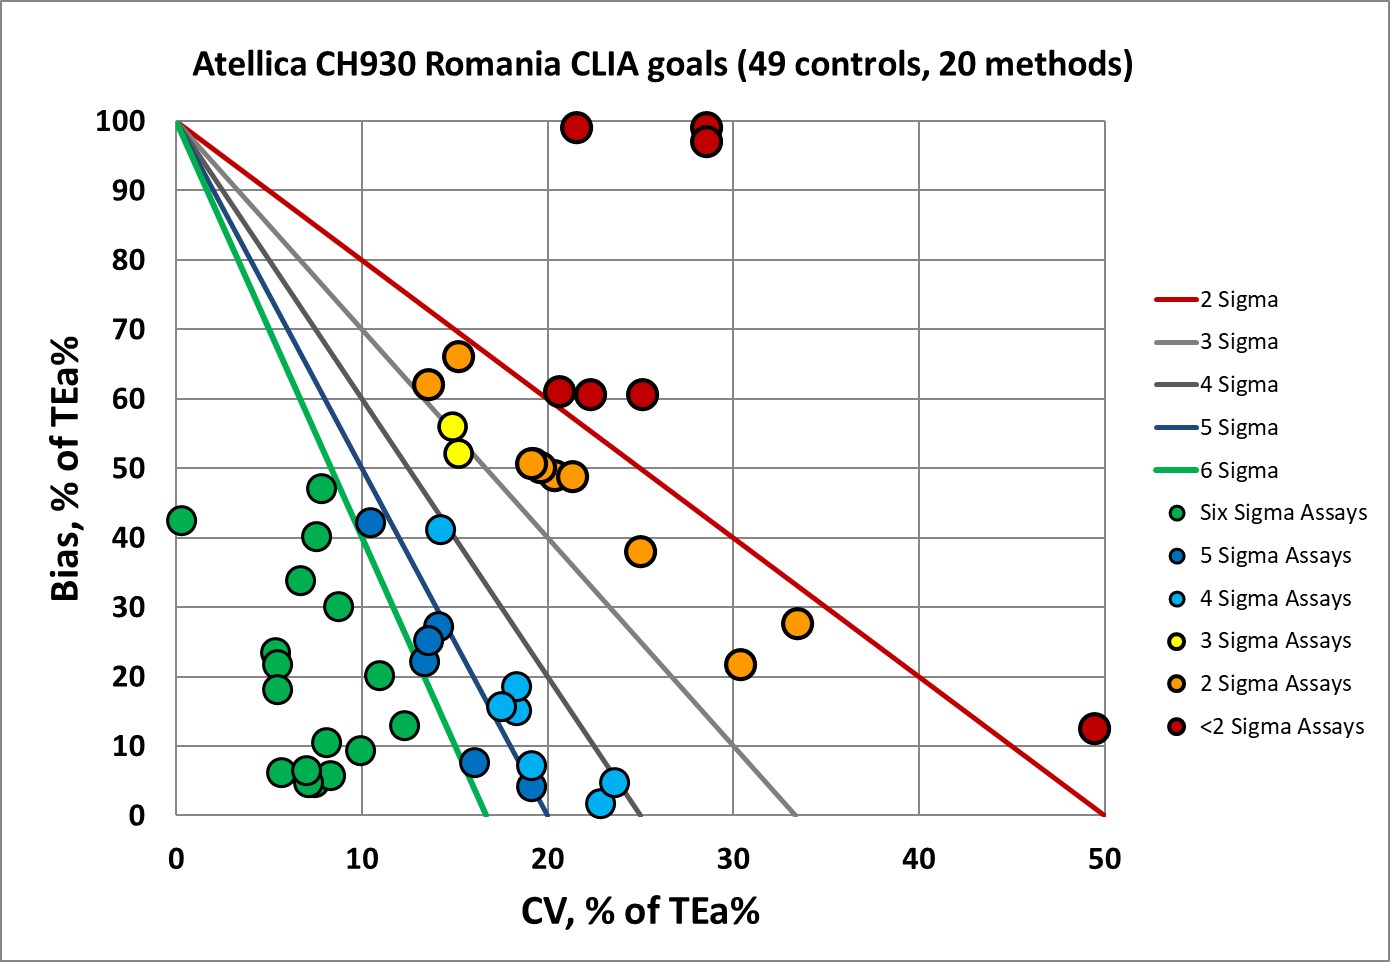
Sigma-metrics according to CLIA 1992 performance specifications
If you judge the Atellica with the oldest specifications, also the most popular ones in the USA. Now only a third of the assays are below 3 Sigma, and a third of the assays are above 6 Sigma.
| Test | % TEa | % Bias | % CV | Sigma metric |
| Albumin | 10 | 12.40 | 2.16 | negative |
| Albumin | 10 | 6.60 | 1.52 | 2.2 |
| Albumin | 10 | 4.10 | 1.43 | 4.1 |
| Alk Phos | 30 | 1.40 | 2.25 | >6 |
| Alk Phos | 30 | 1.80 | 1.72 | >6 |
| ALT | 20 | 10.40 | 3.05 | 3.1 |
| ALT | 20 | 12.40 | 2.72 | 2.8 |
| Amylase | 30 | 7.00 | 1.62 | >6 |
| Amylase | 30 | 6.50 | 1.66 | >6 |
| AST | 20 | 11.20 | 2.98 | 3.0 |
| AST | 20 | 12.20 | 4.13 | 1.9 |
| Bilirubin, Total | 28.57 | 12.10 | 0.10 | >6 |
| Bilirubin, Total | 20.00 | 12.10 | 5.03 | 1.6 |
| Bilirubin, Total | 20.00 | 12.10 | 4.47 | 1.8 |
| Calcium | 14.26 | 5.40 | 3.57 | 2.5 |
| Calcium | 9.07 | 2.50 | 3.04 | 2.2 |
| Calcium | 7.40 | 1.60 | 2.25 | 2.6 |
| Cholesterol | 10.00 | 2.70 | 1.42 | 5.1 |
| Cholesterol | 10.00 | 2.20 | 1.34 | 5.8 |
| Creatinine Kinase (CK) | 30.00 | 1.70 | 2.51 | >6 |
| Creatinine Kinase (CK) | 30.00 | 1.40 | 2.16 | >6 |
| Creatinine | 18.75 | 0.30 | 4.29 | 4.3 |
| Creatinine | 15.00 | 0.70 | 3.55 | 4.0 |
| Glucose | 13.33 | 1.00 | 2.15 | 5.7 |
| Glucose | 10.00 | 0.40 | 1.92 | 5.0 |
| Glucose | 10.00 | 0.70 | 1.92 | 4.8 |
| Iron | 20.00 | 2.50 | 9.90 | 1.8 |
| Iron | 20.00 | 3.00 | 3.68 | 4.6 |
| Iron | 20.00 | 3.70 | 3.68 | 4.4 |
| LDH | 20.00 | 5.00 | 2.73 | 5.5 |
| LDH | 20.00 | 4.00 | 2.20 | >6 |
| Magnesium | 25.00 | 3.90 | 4.39 | 4.8 |
| Magnesium | 25.00 | 3.20 | 3.08 | >6 |
| Magnesium | 25.00 | 2.60 | 2.03 | >6 |
| Potassium | 16.67 | 3.00 | 0.92 | >6 |
| Potassium | 8.62 | 2.90 | 0.58 | >6 |
| Potassium | 6.67 | 2.80 | 0.70 | 5.5 |
| Protein, Total | 10 | 3.00 | 0.88 | >6 |
| Protein, Total | 10 | 4.00 | 0.76 | >6 |
| Protein, Total | 10 | 4.70 | 0.79 | >6 |
| Sodium | 3.48 | 1.70 | 0.71 | 2.5 |
| Sodium | 2.96 | 1.50 | 0.57 | 2.6 |
| Sodium | 2.67 | 1.30 | 0.57 | 2.4 |
| Triglycerides | 25 | 2.30 | 2.49 | >6 |
| Triglycerides | 25 | 1.60 | 1.77 | >6 |
| Urea Nitrogen | 9.00 | 11.40 | 2.57 | negative |
| Urea Nitrogen | 9.00 | 9.70 | 2.57 | negative |
| Uric Acid | 17.00 | 8.50 | 3.34 | 2.5 |
| Uric Acid | 17.00 | 8.60 | 3.26 | 2.6 |
Note that the CLIA goals have unit-based goals for some analytes, like sodium, so in the table we converted them a %-based goal.
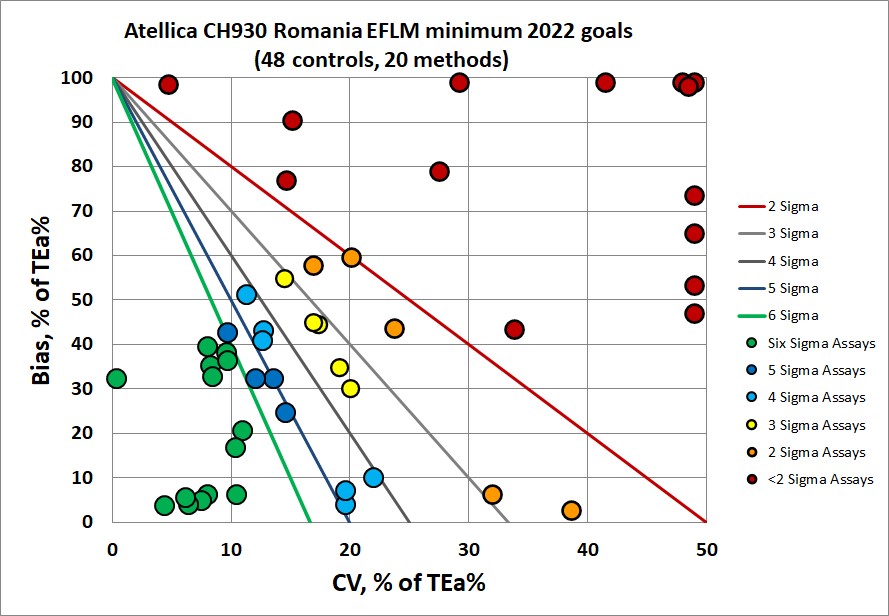
Sigma-metrics according to EuBIVAS-derived MINIMUM performance specifications (as of July 2022)
| Test | TEa | % Bias | % CV | Sigma metric |
EFLM MAU | PASS? |
| Albumin | 5.2 | 12.40 | 2.16 | negative | 3.8 | pass |
| Albumin | 5.2 | 6.60 | 1.52 | negative |
3.8 | pass |
| Albumin | 5.2 | 4.10 | 1.43 | negative | 3.6 | pass |
| Alk Phos | 21.7 | 1.40 | 2.25 | 9.0 | 9.9 | pass |
| Alk Phos | 21.7 | 1.80 | 1.72 | 11.6 |
9.9 | pass |
| ALT | 24.1 | 10.40 | 3.05 | 4.5 | 15.1 | pass |
| ALT | 24.1 | 12.40 | 2.72 | 4.3 | 15.1 | pass |
| Amylase | 19.8 | 7.00 | 1.62 | 7.9 | 9.9 | pass |
| Amylase | 19.8 | 6.50 | 1.66 | 8.0 | 9.9 | pass |
| AST | 20.5 | 11.20 | 2.98 | 3.1 | 14.4 | pass |
| AST | 20.5 | 12.20 | 4.13 | 2.0 | 14.4 | pass |
| Bilirubin, Direct | 2.60 | 7.75 | ||||
| Bilirubin, Direct | 2.90 | 5.75 | ||||
| Bilirubin, Direct | 3.20 | 5.75 | ||||
| Bilirubin, Total | 37.3 | 12.10 | 0.10 | >6 | 30 | pass |
| Bilirubin, Total | 37.3 | 12.10 | 5.03 | 5.0 | 30 | pass |
| Bilirubin, Total | 37.3 | 12.10 | 4.47 | 5.6 | 30 | pass |
| Calcium | 3.4 | 5.40 | 3.57 | negative |
2.7 | fail |
| Calcium | 3.4 | 2.50 | 3.04 | 0.3 |
2.7 | fail |
| Calcium | 3.4 | 1.60 | 2.25 | 0.8 | 2.7 | pass |
| Cholesterol | 13.0 | 2.70 | 1.42 | >6 | 7.9 | pass |
| Cholesterol | 13.0 | 2.20 | 1.34 | >6 | 7.9 | pass |
| Creatinine Kinase (CK) | 33.8 | 1.70 | 2.51 | >6 | 22.5 | pass |
| Creatinine Kinase (CK) | 33.8 | 1.40 | 2.16 | >6 |
22.5 | pass |
| Creatinine | 11.1 | 0.30 | 4.29 | 2.5 | 6.8 | pass |
| Creatinine | 11.1 | 0.70 | 3.55 | 2.9 | 6.8 | pass |
| GGT | 28.3 | 8.50 | 5.68 | 3.5 | 13.6 | pass |
| GGT | 28.3 | 7.00 | 4.11 | 5.2 | 13.6 | pass |
| Glucose | 9.8 | 1.00 | 2.15 | 4.1 | 7.5 | pass |
| Glucose | 9.8 | 0.40 | 1.92 | 4.9 | 7.5 | pass |
| Glucose | 9.8 | 0.70 | 1.92 | 4.7 | 7.5 | pass |
| LDH | 11.5 | 5.00 | 2.73 | 2.4 | 7.8 | pass |
| LDH | 11.5 | 4.00 | 2.20 | 3.4 | 7.8 | pass |
| Magnesium | 6.00 | 3.90 | 4.39 | 0.5 | 4.3 | fail |
| Magnesium | 6.00 | 3.20 | 3.08 | 0.9 | 4.3 | pass |
| Magnesium | 6.00 | 2.60 | 2.03 | 1.7 | 4.3 | pass |
| Potassium | 7.3 | 3.00 | 0.92 | 4.7 | 6.1 | pass |
| Potassium | 7.3 | 2.90 | 0.58 | 7.6 | 6.1 | pass |
| Potassium | 7.3 | 2.80 | 0.70 | 6.4 | 6.1 | pass |
| Protein, Total | 5.2 | 3.00 | 0.88 | 2.5 | 3.9 | pass |
| Protein, Total | 5.2 | 4.00 | 0.76 | 1.6 |
3.9 | pass |
| Protein, Total | 5.2 | 4.70 | 0.79 | 0.6 | 3.9 | pass |
| Sodium | 1.0 | 1.70 | 0.71 | negative | 0.8 | pass |
| Sodium | 1.0 | 1.50 | 0.57 | negative | 0.8 | pass |
| Sodium | 1.0 | 1.30 | 0.57 | negative | 0.8 | pass |
| Triglycerides | 40.6 | 2.30 | 2.49 | >6 | 30.0 | pass |
| Triglycerides | 40.6 | 1.60 | 1.77 | >6 | 30.0 | pass |
| Urea Nitrogen | 26.6 | 11.40 | 2.57 | 5.9 | 10.9 | pass |
| Urea Nitrogen | 26.6 | 9.70 | 2.57 | 6.6 | 10.9 | pass |
| Uric Acid | 19.2 | 8.50 | 3.34 | 3.2 | 12.5 | pass |
| Uric Acid | 19.2 | 8.60 | 3.26 | 3.3 | 12.5 | pass |
Interesting to see the differences. Nearly 40% of the performance is considered below 3 Sigma, even by the most relaxed EFLM minimum performance specifications. Yet nearly every level - More than 93%- of this performance "passes" the MAU / EAMMU specification. The relaxed measurement uncertainty goals are even looser than EFLM's minimum specifications, which are the least demanding TEa goals seen here.
If MAU is simply a rubber stamp, giving approval to all methods, it does not lead to any progress. It merely enables a status quo.
Sigma-metrics according to CLIA 2024 performance specifications
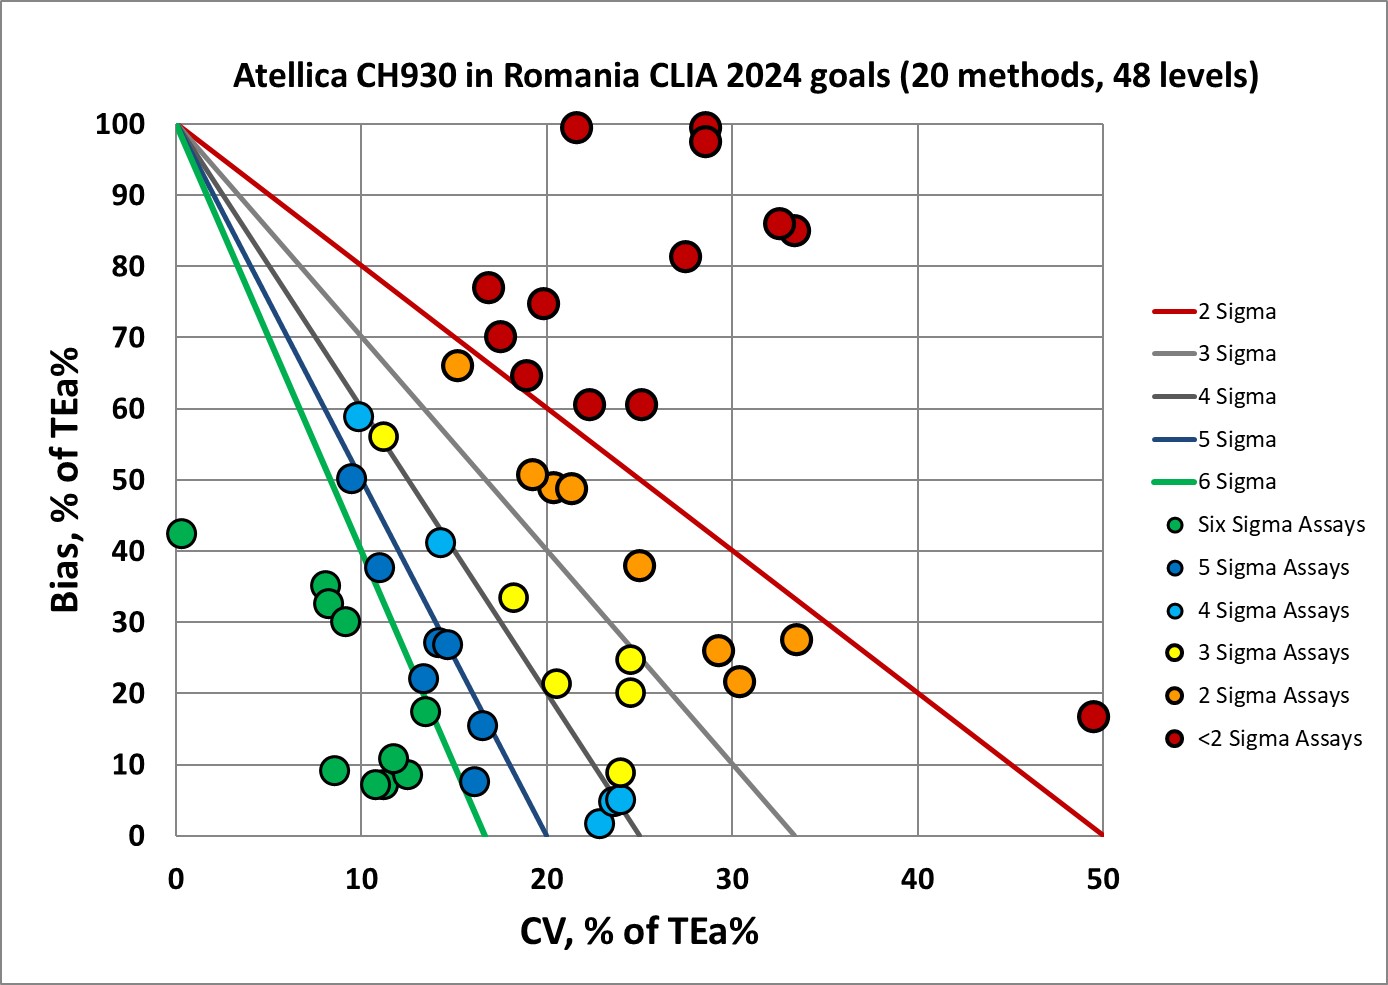
The new CLIA 2024 goals are no pushover. Over 40% of the levels here are below 3 Sigma, and 14% are 3 Sigma, so the majority of performance here is 3 Sigma or lower. Only 20% of the performance hits the bull's-eye. If this lab was in the US, proficiency testing would be a scary event.
Conclusion
This data set doesn't really look good from any perspective, but the desirable EFLM goals are the most difficult to achieve, followed by the CLIA 2024 goals. EFLM minimum goals are easier to achieve than CLIA's new standards, which represents a major shift in the hierarchy of goals. Even applying goals from CLIA that are 3 decades old is not successful. This provides another example of the danger of adopting performance specifications out of popular enthusiasm, rather than practical capability. We need a bigger conversation about what goals are appropriate to apply to today's instruments, not just applying goals because we can calculate them.