Sigma Metric Analysis
Multimode analysis of a MicroLab RX-50 in India
In our multimode analysis series, we've focused on the performance of the major diagnostic manufacturers. But when EFLM gets wider and CLIA gerts tighter, other instruments are impacted, too. This time we look at a small benchtop analyzer in India, the MicroLab RX-50. While this small device succeed where the big boxes failed?
Multimode analysis of a MicroLab RX-50 in India
October 2022
Sten Westgard, MS
Keeping up with our series on major instrument analysis, it's time to take a look at a small device: The MicroLab RX-50. This analysis will use the latest desirable and minimum performance specifications from the EFLM, as well as Ricos 2014, and CLIA 1992 and CLIA 2024 goals.
See the other analyses in this series:
- Beckman Coulter DxC 700
- Abbott Alinity
- Siemens Atellica
- Siemens Atellica in Romania
- Siemens Atellica in Spain
- Siemens ADVIA 2120i
- Roche c501 in Turkey
- Roche c501 in Saudi Arabia
- MicroLab RX-50 in India
- Roche cobas 6000 immunoassays in Turkey
- Sysmex XN 350 in India
- Mindray 7500 in China
- Mindray BS 2000M in China
The MicroLab RX-50 data comes from GMERS Medical College in Vadnagar, Gujarat, India:
Application of Six Sigma tool as Quality Indicator for evaluation of analytical phase of sample processing, Margi Gajjar, Jigar Parmar, Guarav Modi, Dipti Gajjar, International Journal of Health and Clinical Research, 2022;5(3):613-617.
The study was conducted with data from January to December 2020. Imprecision was estimated as the average of the monthly CVs of two Erba control materials, a Norm(al) and a Path(ological). Bias was estimated as the average of the monthly EQAS reports. The paper looked at 14 common biochemistry tests.
| MicroLab RX-50 India | ||
| TEST | % Bias | CV |
| Albumin | 0.95 | 3.13 |
| Albumin | 0.95 | 4.18 |
| Alk Phos | 5.15 | 9.02 |
| Alk Phos | 5.15 | 10.68 |
| ALT | 0.83 | 4.15 |
| ALT | 0.83 | 4.22 |
| Amylase | 0.12 | 6.34 |
| Amylase | 0.12 | 7.64 |
| AST | 0.21 | 4.48 |
| AST | 0.21 | 2.98 |
| Total Bilirubin | 1.74 | 5.33 |
| Total Bilirubin | 1.74 | 3.75 |
| Cholesterol | 1.38 | 6.86 |
| Cholesterol | 1.38 | 4.85 |
| Creatinine | 0.61 | 2.48 |
| Creatinine | 0.61 | 3.65 |
| Glucose | 0.48 | 2.91 |
| Glucose | 0.48 | 2.30 |
| D-HDL | 3.50 | 15.59 |
| D-HDL | 3.50 | 16.08 |
| Protein, Total | 1.24 | 3.53 |
| Protein, Total | 1.24 | 3.12 |
| Triglycerides | 0.02 | 12.58 |
| Triglycerides | 0.02 | 10.06 |
| Uric Acid | 0.90 | 5.00 |
| Uric Acid | 0.90 | 6.43 |
| Urea Nitrogen | 0.05 | 3.00 |
| Urea Nitrogen | 0.05 | 2.94 |
Please note the imprecision is determined on two different control levels, but the bias is one average bias, so the same bias will be used for all Sigma-metric calculations for each of the analytes. This will result in pairs of dots in the graphs that follow.
The analysis will use the performance specifications from latest (2022) EFLM, both minimum and desirable as derived from the EuBIVAS biological variation database, as well as the desirable goals from the Ricos 2014 performance specifications; and finally the 1992 and newly announced 2024 CLIA goals.
Sigma-metrics according to EuBIVAS-derived DESIRABLE performance specifications
The EFLM desirable specifications used to be the global standard, but have fallen out of favor due to their toughness and demanding nature. The EFLM database used to calculate and display the desirable performance specifications.
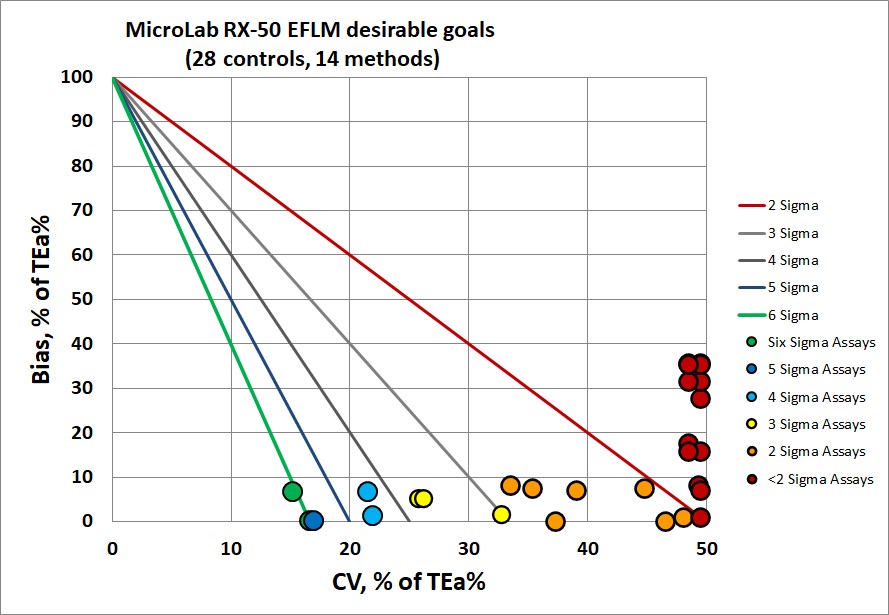
If those goals are used, there is almost nothing at the level of Six Sigma, and the vast majority of performance (71%) is poor, unacceptable, and off the charts bad. Notice there isn't that much trouble with bias, it's mainly imprecision that is too, too high.
So what happens if we lower the EFLM standards?.
Sigma-metrics according to EuBIVAS-derived MINIMUM performance specifications
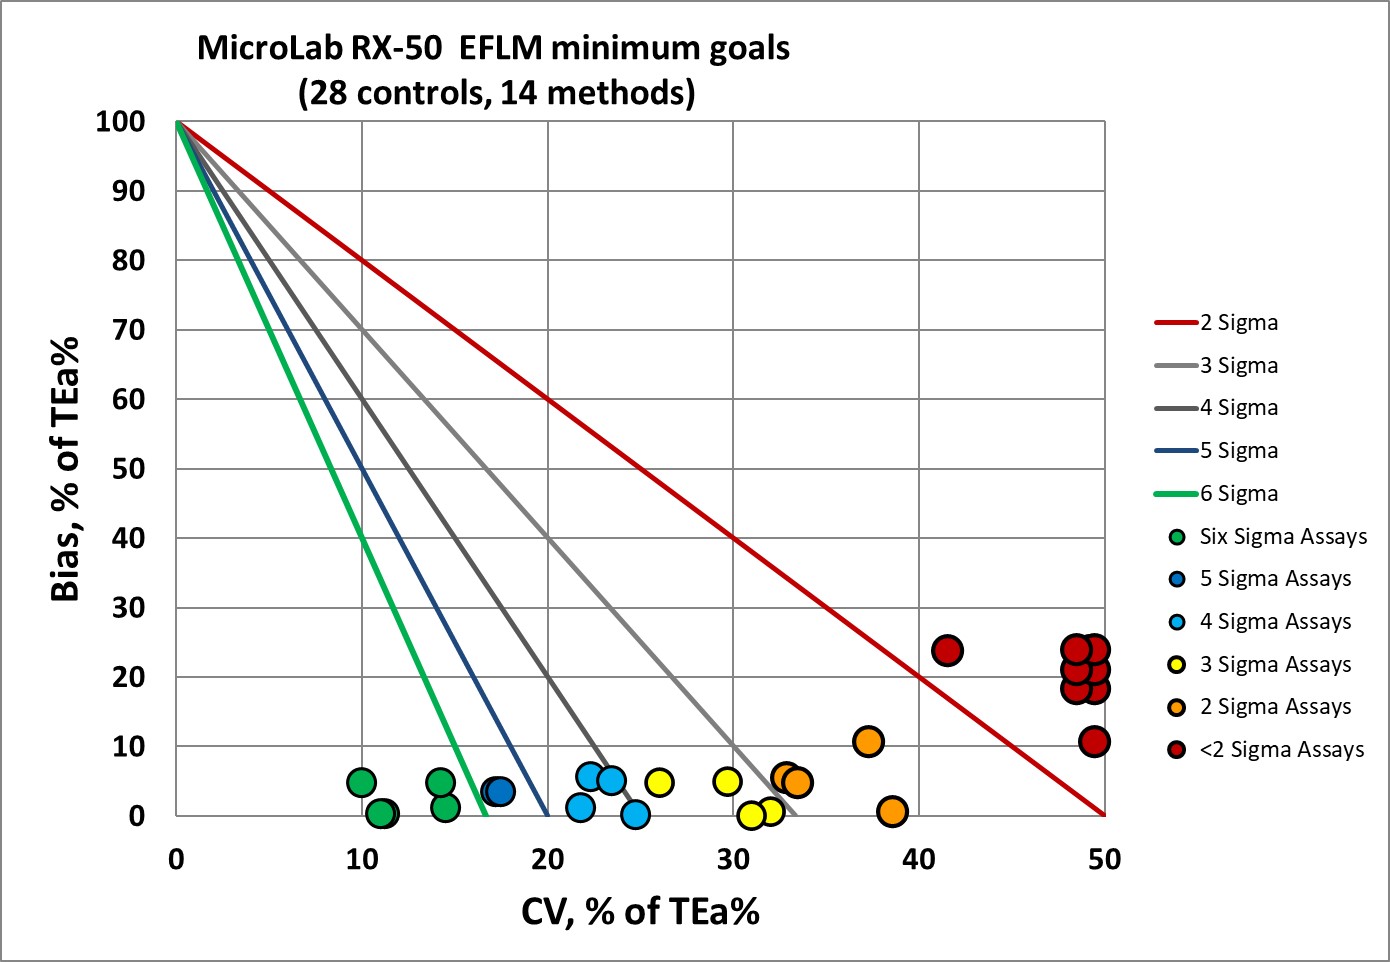
There is a big improvement, now less than half of the performance (46%) is in the danger zones. Even the minimum specifications for these analytes are quite demanding. Urea and Total Bilirubin are now in the Six Sigma zone.
Next, let's look at the "original" version of the biological variation database. The last version of the database was updated in 2014 by Ricos et al, so we refer to these performance specifications as Ricos 2014 goals.
Sigma-metrics according to Ricos 2014 desirable performance specifications
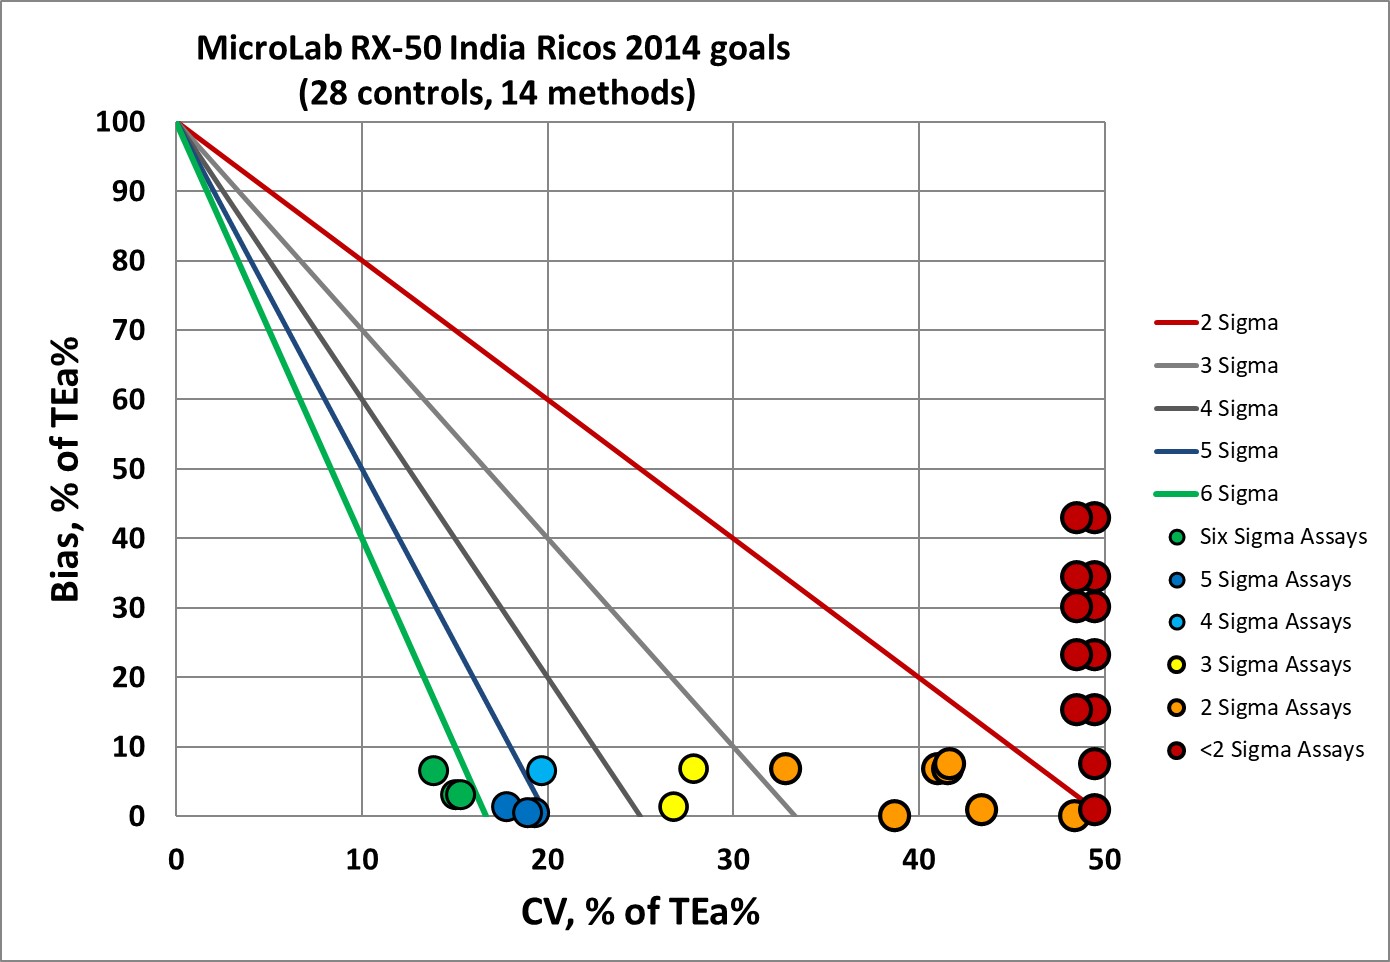
The original Ricos goals are nearly as hard on this RX-50 as the EFLM desirable goals. We still see about 67% of the values below 3 Sigma.
What happens if we move away from biologically-derived goals toward the CLIA goals, including those newly announced to take effect in 2024? Let's start with the original, now "classic" CLIA goals issued in 1992.
Sigma-metrics according to CLIA 1992 performance specifications
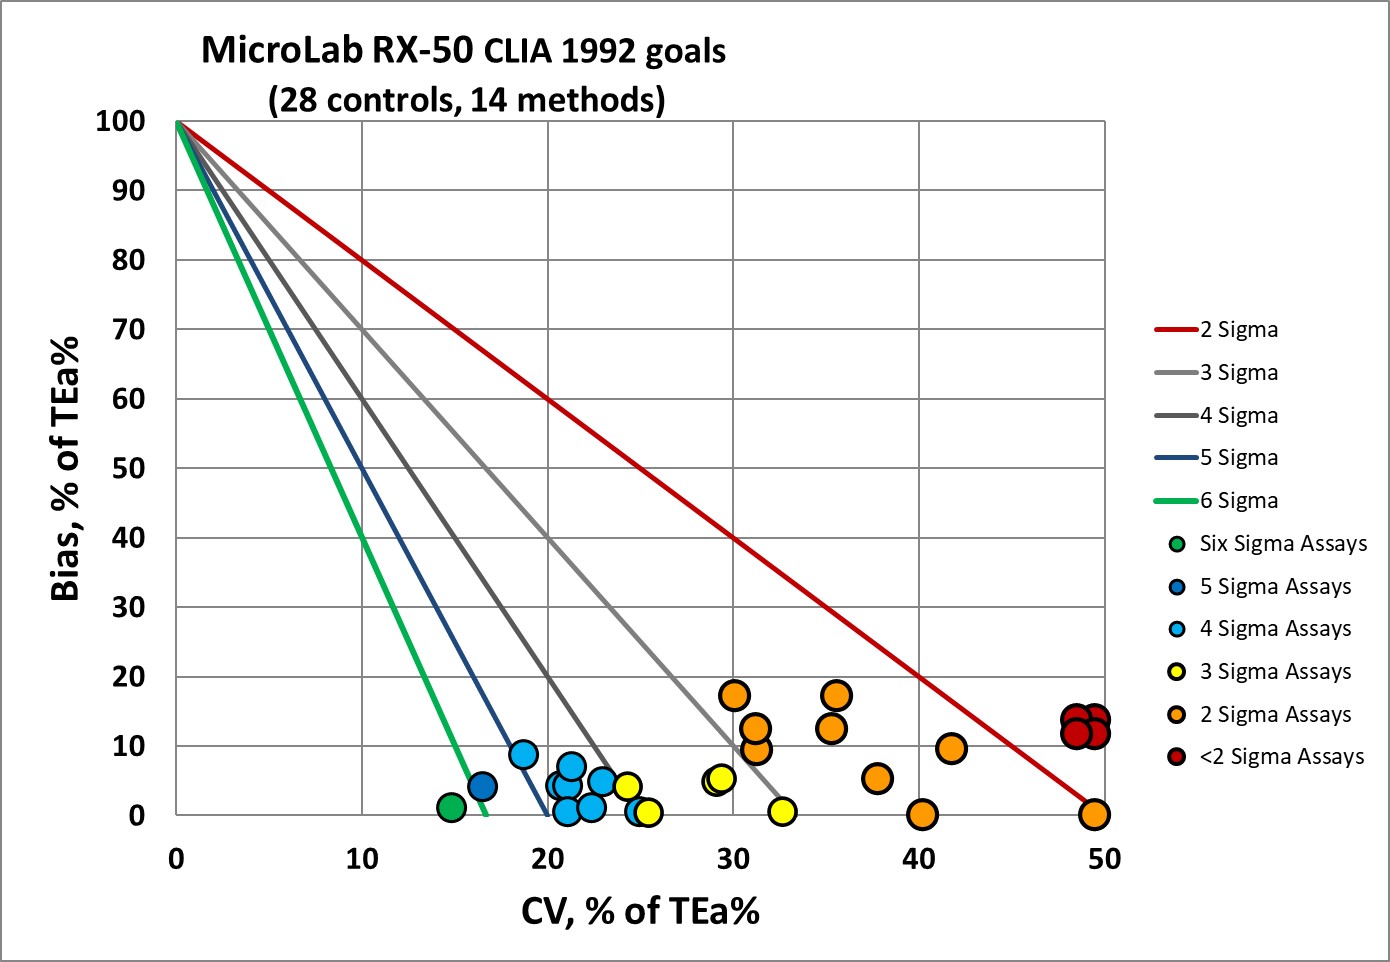
If you judge the RX-50 with the oldest specifications, also the most popular ones in the USA, you still get about 46% of the performance below 3 Sigma. There are just more 2 Sigma assays than <1 Sigma assays, an improvement that doesn't quite help.
What happens when CLIA tightens its goals?
Sigma-metrics according to CLIA 2024 performance specifications
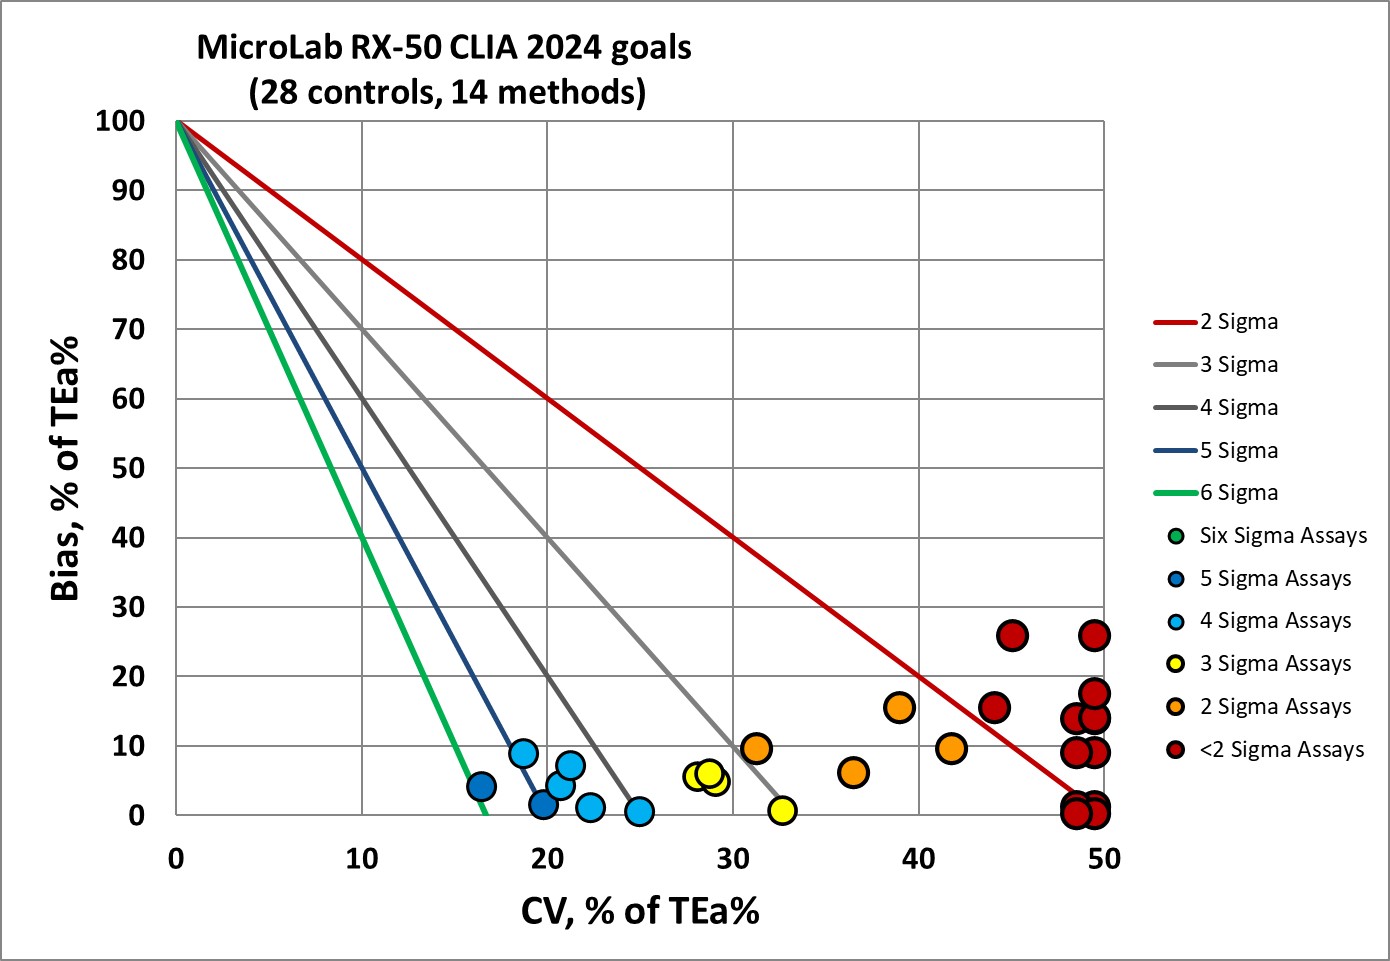
CLIA 2024 still marks over 60% of this performance as less than 3 Sigma. And uniquely, NO assays at 6 Sigma. In some ways, these CLIA goals are most demanding set to apply to this instrument.
Conclusion
Of our multimode analyses thus far, RX-50 is easily dead last. By any set of benchmarks, this small benchtop analyzer is bad. Its results should be used with great worry. Noise might confuse the patient's true health status.
Should we be relieved, that all of the performance specifications here will weed out the least of our analyzers? It's a small consolation. But certainly noteworthy to see that the two sets of goals that were closest in their judgements were CLIA 2024 and Ricos 2014.