Sigma Metric Analysis
Roche cobas 6000 c501 in Saudi Arabia, multimode analysis
We look at the impact of new CLIA and EFLM goals on the assessment of a Roche cobas 6000 c501 instrument in Saudi Arabia.
Roche cobas 6000 c501 in Saudi Arabia, multimode analysis
February 2023
Sten Westgard, MS
See the other analyses in this series:
- Beckman Coulter DxC 700
- Abbott Alinity
- Siemens Atellica
- Siemens Atellica in Romania
- Siemens Atellica in Spain
- Siemens ADVIA 2120i
- Roche c501 in Turkey
- Roche c501 in Saudi Arabia
- MicroLab RX-50 in India
- Roche cobas 6000 immunoassays in Turkey
- Sysmex XN 350 in India
- Mindray 7500 in China
- Mindray BS 2000M in China
This Roche cobas 6000 c501 study comes from Saudi Arabia, possibly from King Abdulaziz Specialist Hospital, although the paper only specifies it as the "Department of Laboratory and Blood Bank of an accredited teriary care hospital":
Evaluation of Measurement Performance of Routine Chemistry Analytes by Application of Sigma Metrics, Method Evaluation Decision (MEDx) Charts and Quality Goal Index (QGI). Awan TM, Al Baiomy AA, Malik MH, Al-Ruwaili FK, Abdelrahman R, and Al-Johani AZ, J Biomed Res Environ Sci, https://www.jelsciences.com/articles/jbres1665.pdf
"This prospective study was carried out over a period of 6 months from Jan to June 2022....[T]wo levels of QC material are run i.e. normal L1 and pathological L2 from Roche Germany, daily in the morning shift and on 'as and when required' basis during evening and the night shifts...."
"Monthly %Bias for an analyte is estimated by the RIQAS-EQAS program based on the difference between the monthly EQA result obtains by the laboratory's method and the peer group mean for comparison calculated from results of all the participating laboratories from all over the world....Average of these monthly %Deviations for a period of 6 months was taken to estimate the Average %Bias."
The use of manufacturer controls are a weakness of this study, as they are less likely to provide an honest, independent assessment of the performance of the instrument. But we'll go ahead and use them, because, as you will see, even the most optimistic controls don't provide a rosy picture.
There are two levels that will be analyzed here, for 24 parameters when possible. The study covered the Direct Bilirubin analyte, but since neither the EFLM nor the CLIA 1992 or 2024 have specific performance criteria for this analyte, we will omit it here in this study. So for 12 parameters there will be 24 data points to plot on the Normalized Method Decision Chart. Note that, since there are 2 observed CVs but only one observed bias, the plotted points may visually appear as bands. Also, when data points are plotted at the edge of the graph, this indicates the imprecision has exceeded the allowable specification significantly. Also, those data points at the edge will be plotted with slightly different biases in order to show both points.
The TEa goals applied can be found on our Consolidated Chemistry Performance Specifications page.
| TEST | % Bias | %CV |
| Albumin | 2.48 | 2.46 |
| Albumin | 2.48 | 1.96 |
| Alk Phos | 1.34 | 2.75 |
| Alk Phos | 1.34 | 2.39 |
| ALT | 5.38 | 2.92 |
| ALT | 5.38 | 2.67 |
| Amylase | 1.70 | 1.96 |
| Amylase | 1.70 | 2.23 |
| AST | 2.93 | 2.13 |
| AST | 2.93 | 2.18 |
| Total Bilirubin | 2.90 | 4.75 |
| Total Bilirubin | 2.90 | 5.03 |
| Calcium | 0.85 | 1.78 |
| Calcium | 0.85 | 1.76 |
| Chloride | 0.18 | 2.31 |
| Chloride | 0.18 | 2.28 |
| Cholesterol | 0.60 | 2.14 |
| Cholesterol | 0.60 | 2.02 |
| CK | 1.17 | 2.14 |
| CK | 1.17 | 2.32 |
| Creatinine | 0.78 | 3.05 |
| Creatinine | 0.78 | 2.81 |
| GGT | 2.48 | 1.86 |
| GGT | 2.48 | 1.80 |
| Glucose | 1.23 | 2.01 |
| Glucose | 1.23 | 1.85 |
| D-HDL | 0.27 | 1.78 |
| D-HDL | 0.27 | 1.89 |
| Iron | 3.28 | 4.29 |
| Iron | 3.28 | 3.36 |
| LDH | 3.80 | 4.82 |
| LDH | 3.80 | 5.07 |
| Magnesium | 0.82 | 2.15 |
| Magnesium | 0.82 | 2.19 |
| Phosphorous | 1.78 | 3.18 |
| Phosphorous | 1.78 | 2.61 |
| Potassium K | 0.30 | 2.29 |
| Potassium K | 0.30 | 2.12 |
| Protein, Total | 3.05 | 2.15 |
| Protein, Total | 3.05 | 2.27 |
| Sodium | 0.38 | 2.00 |
| Sodium | 0.38 | 1.98 |
| Triglycerides | 4.65 | 4.05 |
| Triglycerides | 4.65 | 3.91 |
| Uric Acid | 1.43 | 2.39 |
| Uric Acid | 1.43 | 2.51 |
| Urea Nitrogen | 0.09 | 2.77 |
| Urea Nitrogen | 0.09 | 2.64 |
Sigma-metrics according to EFLM-derived DESIRABLE performance specifications
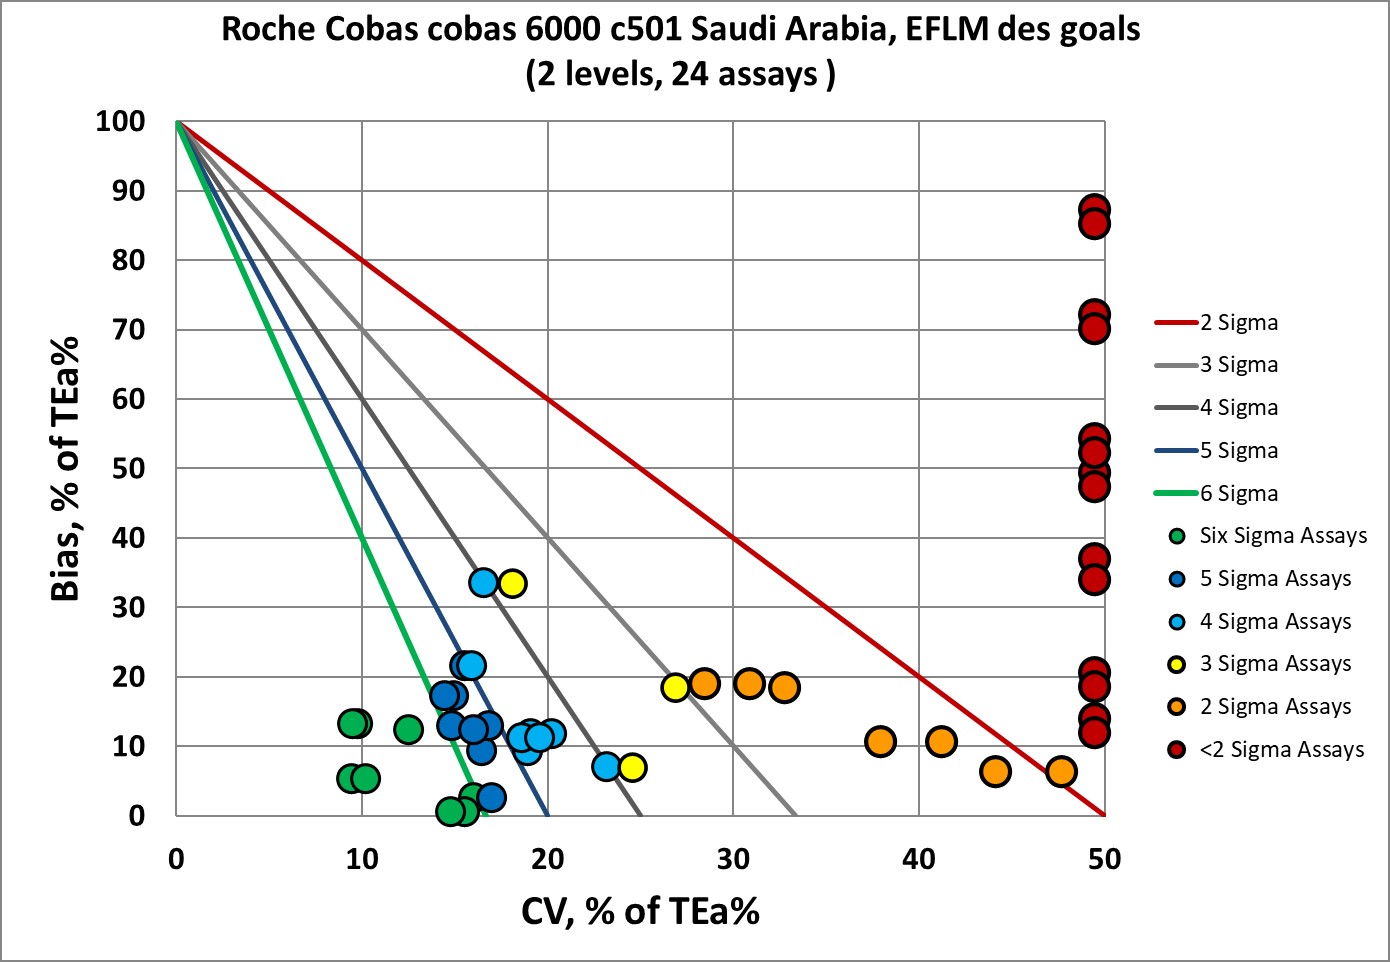
The EFLM desirable specifications used to be the de facto global standard, but have fallen out of favor due to their toughness.
The Roche cobas 6000 c501 has 43% of the performance below 3 Sigma, and fully half of the performance is at 3 sigma or lower.
Only 8 of the 48 points are in the Six Sigma zone.
Not surprising then, that EFLM recommended lowering the standards.
Sigma-metrics according to EuBIVAS-derived MINIMUM performance specifications
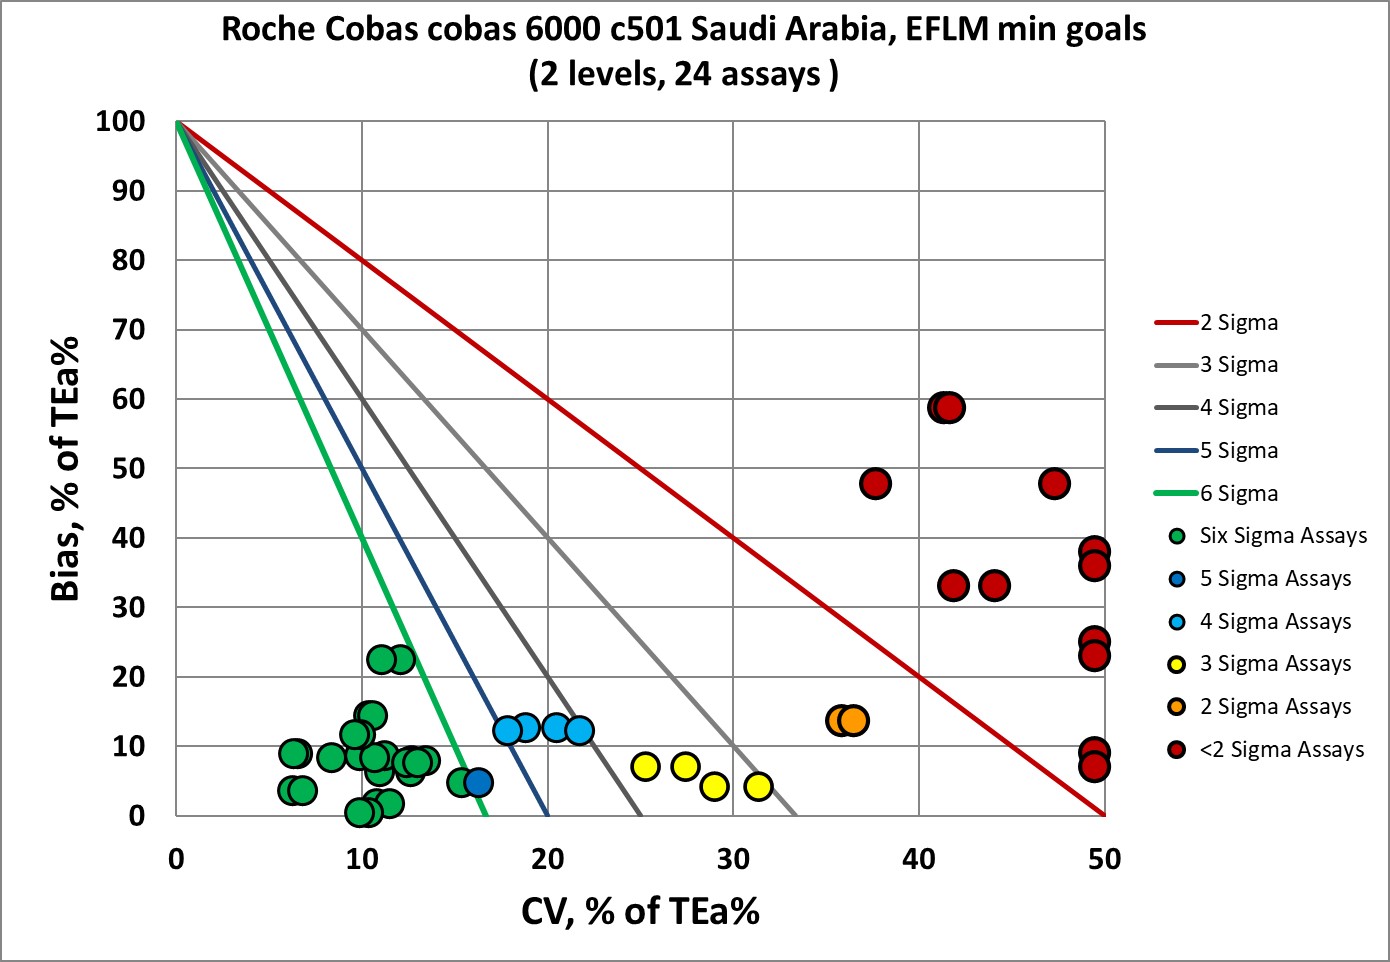
There is an improvement, now a majority of the performance is in the Six Sigma zone, and only about a one-third of that performance is at 3 Sigma or lower.
Here's one of the most interesting new aspects of CLIA's 1992 and new 2024 goals. Are they more or less demanding than EFLM goals?
Sigma-metrics according to CLIA 1992 performance specifications
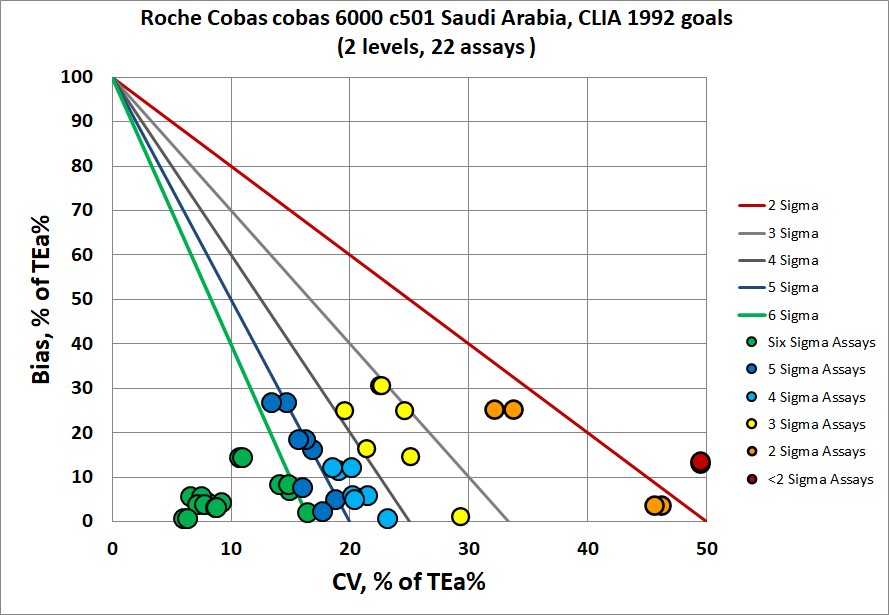
Now, some assays are not covered by CLIA 1992, so not all assays are able to be plotted. But those that are, there is one-third that is in the Six Sigma zone, and one-third that are 3 Sigma or lower. Note this: CLIA 1992 is less forgiving than EFLM minimum specifications.
Sigma-metrics according to CLIA 2024 performance specifications
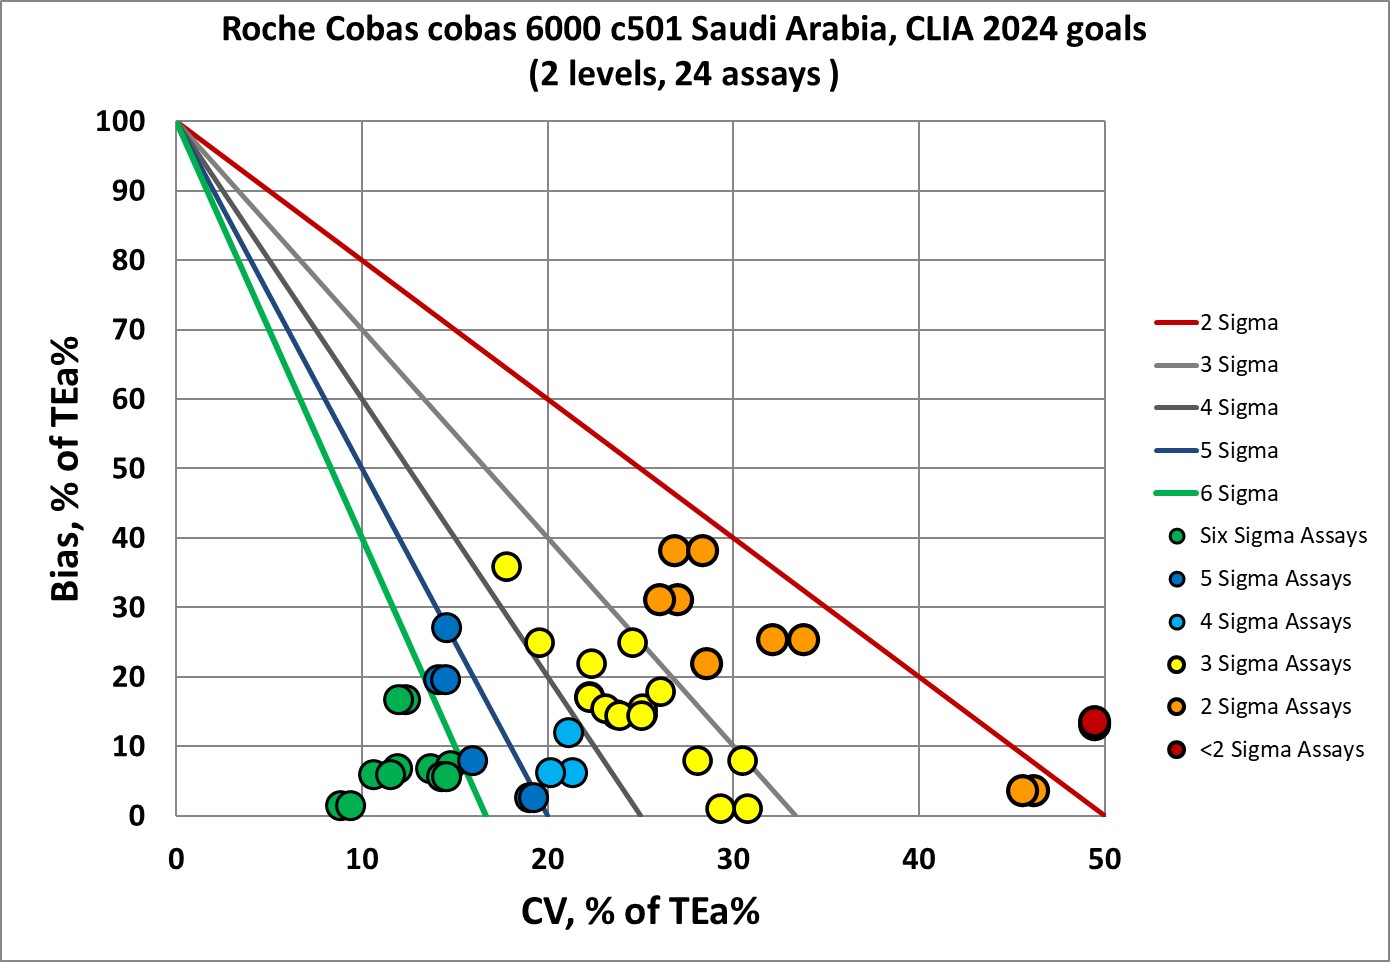
The CLIA 2024 goals are more stringent than CLIA 1992, obviously. But less than one-quarter of the performance falls into the Six Sigma zone, and a majority of performance is at 3 Sigma and lower. CLIA 2024 is more demanding than the EFLM minimum goals.
Conclusion
Even with possibly the most favorable assessment (from their own controls), the Roche Cobas 6000 c501 is not able to meet a significant number of the the desirable EFLM goals and the CLIA 2024 goals. While EFLM minimum specifications are the most forgiving goals for judging this instrument, they do not give the instrument an easy grade. This is another example showing that the new CLIA 2024 goals are challenging to even the most advanced instruments on the market.
Bonus Analysis: How are these assays judged when MU is compared to MAU, pU specifications?
While the original publication didn't intend to assess uncertainty, since imprecision was measured, the simple estimation of uncertainty can be made (take 2x the imprecision). The imprecision was measured over 6 months, which is a match for the stated requirements of estimating mu. We're not going to add in the bias estimate as another variance, most likely that would make all the uncertainties unacceptable. But perhaps these optimistic estimates are able to meet these MU specifications. Is MU more forgiving than the EFLM and CLIA goals?
| Roche Cobas 6000 c501 |
Level | % simple Expanded Uncertainty |
EFLM minimum MAU | Panteghini's pU (PpU) |
Final verdict |
| Albumin | 1 | 4.92% | 3.8% |
1.25%(des) |
Fails MAU and PpU |
| 2 | 3.92% | Fails MAU and PpU | |||
| ALT | 1 |
5.84% |
15.1% | 4.65%(des) 6.98%(min) |
Passes min PpU, passes min MAU |
| 2 | 5.34% | Passes min PpU, passes min MAU |
|||
| Alk Phos | 1 |
5.5% |
9.9% | 2.65%(des) 3.98%(min) |
Fails PpU, passes min MAU |
| 2 | 4.78% | Fails PpU, passes min MAU |
|||
| Amylase | 1 | 3.92% | 9.9% | 3.15% (des) 4.73% (min) |
Passes min PpU, passes min MAU |
| 2 | 4.46% | Passes min PpU, passes min MAU |
|||
| AST | 1 | 4.26% | 14.4% | 4.75% (des) 7.13% (min) |
Passes des PpU, passes min MAU |
| 2 | 4.36% | Passes des PpU, passes min MAU |
|||
| Bilirubin, Total | 1 | 9.5% | 30% | 10.3% (des) 15.7% (min) |
Passes des Ppu passes min MAU |
| 2 | 10.06% | Passes des Ppu passes min MAU |
|||
| Calcium | 1 | 3.56% | 2.7% | 0.91% (des) 1.36% (min) |
Fails MAU and PpU |
| 2 | 3.52% | Fails MAU and PpU | |||
| Chloride | 1 | 4.62% | 1.7% | 0.49% (des) 0.74% (min) |
Fails MAU and PpU |
| 2 | 4.56% | Fails MAU and PpU | |||
| Cholesterol | 1 | 4.28% | 7.95% | 3% (des) 7% (min) |
Passes min Ppu passes min MAU |
| 2 | 4.04% | Passes min Ppu passes min MAU |
|||
| CK | 1 | 4.28% | 22.5% | 7.25% (des) 10.9% (min) |
Passes min MAU and Ppu |
| 2 | 4.64% | Passes min MAU and Ppu | |||
| Creatinine | 1 | 6.1% | 6.8% | 2.2% (des) 3.3% (min) |
Fails Ppu passes min MAU |
| 2 | 5.62% | Fails Ppu passes min MAU |
|||
| GGT | 1 | 3.72% | 13.6% | 4.45% (des) 6.68% (min) |
Passes min MAU and Ppu |
| 2 | 3.6% | Passes min MAU and Ppu | |||
| Glucose | 1 | 4.02% | 7.5% | 2% (des) 3% (min) |
Fails Ppu passes min MAU |
| 2 | 3.7% | Fails Ppu passes min MAU |
|||
| HDL Cholesterol | 1 | 3.56% | 8.7% | 2.84% (des) 4.26% (min) |
Passes min MAU and Ppu |
| 2 | 3.78% | Passes min MAU and Ppu | |||
| Iron | 1 | 8.58% | 31.0% | none stated | Passes min MAU |
| 2 | 6.72% | Passes min MAU | |||
| LDH | 1 | 9.64% | 7.8% | 2.6% (des) 3.9% (min) |
Fails MAU and PpU |
| 2 | 10.14% | Fails MAU and PpU | |||
| Magnesium | 1 | 4.3% | 4.3% | 1.44% (des) 2.16% (min) |
Fails PpU Passes min MAU |
| 2 | 4.38% | Fails MAU and PpU | |||
| Phosphorous | 1 | 6.36% | 11.7% | none stated | Passes MAU |
| 2 | 5.22% | Passes MAU | |||
| Potassium | 1 | 4.58% | 6.1% | 1.96% (des) 2.94% (min) |
Fails PpU Passes min MAU |
| 2 | 4.24% | Fails PpU Passes min MAU |
|||
| Sodium | 1 | 4.0% | 0.8% | none stated | Fails MAU |
| 2 | 3.96% | Fails MAU | |||
| Triglycerides | 1 | 8.1% | 30% | 9.9% (des) 14.9% (min) |
Passes min MAU and Ppu |
| 2 | 7.82% | Passes min MAU and Ppu | |||
| Uric acid | 1 | 4.78% | 12.5% | 4.16% (des) 6.24% (min) |
Passes min MAU passes min Ppu |
| 2 | 5.02% | Passes min MAU passes min Ppu |
|||
| Urea Nitrogen | 1 | 5.54% | 20.9% | 7.05% (des) 10.6% (min) |
Passes min MAU passes min Ppu |
| 2 | 5.28% | Passes min MAU passes min Ppu |
If we judge these assays by the various mu performance specifications set forth by EFLM and the work of Panteghini et al, there are far more victories than when these parameters are judged by the TEa benchmarks. This is actually one of the better results for Roche that we've seen recently. MAU and pU are far more forgiving than the use of TEa to set performance specifications.