Sigma Metric Analysis
Roche cobas c702 (two) in Vietnam, multimode analysis
How do new CLIA and EFLM goals on the assessment of two Roche cobas c702 instruments in Vietnam?
Roche cobas c702 in Vietnam, multimode analysis
April 2023
Sten Westgard, MS
See the other analyses in this Multimode series:
- Beckman Coulter DxC 700
- Abbott Alinity
- Siemens Atellica
- Siemens Atellica in Romania
- Siemens Atellica in Spain
- Siemens ADVIA 2120i
- Roche c501 in Turkey
- Roche c501 in Saudi Arabia
- MicroLab RX-50 in India
- Roche cobas 6000 immunoassays in Turkey
- Sysmex XN 350 in India
- Mindray 7500 in China
- Mindray BS 2000M in China
This Roche cobas c702 study comes from Vietnam:
Áp dụng Six Sigma trong đánh giá và so sánh hiệu năng phân tích của hai máy hóa sinh cobas c702, Hà Thị Phương Dung, Lê Hữu Lộc, Nguyễn Ích Việt. TCNCYM 159(11) November 2022 DOI: 10.52852/tcncyh.v159i11.1243
The study looks at TWO cobas c702 instruments with 18 common biochemistry assays. Both Roche and Bio-Rad controls were used to assess imprecision. Bio-Rad Unity reports were also utilized. So we get a chance to see within-lab variability and/or instrument consistency.
The TEa goals applied can be found on our Consolidated Chemistry Performance Specifications page.
| Roche cobas C702 - Instrument 1 | ||
| TEST | % Bias | CV |
| Iron | 2.71 | 2.38 |
| Iron | 1.33 | 1.49 |
| Bilirubin Direct | 1.33 | 2.11 |
| Bilirubin Direct | 0.87 | 1.5 |
| Bilirubin Total | 5.70 | 3.61 |
| Bilirubin Total | 3.02 | 1.51 |
| Calcium | 0.90 | 2.27 |
| Calcium | 0.88 | 1.52 |
| Sodium | 1.47 | 1.32 |
| Sodium | 1.39 | 1.53 |
| Potassium | 1.42 | 1.15 |
| Potassium | 1.33 | 1.54 |
| Chloride | 3.01 | 1.45 |
| Chloride | 1.85 | 1.55 |
| HDL | 3.56 | 1.19 |
| HDL | 2.50 | 1.56 |
| ALT | 0.48 | 4.03 |
| ALT | 2.34 | 1.96 |
| AST | 0.47 | 5.80 |
| AST | 2.34 | 3.63 |
| Cholesterol | 3.18 | 1.71 |
| Cholesterol | 3.39 | 1.58 |
| Creatinine | 3.47 | 2.22 |
| Creatinine | 6.18 | 1.59 |
| GGT | 2.68 | 1.33 |
| GGT | 2.70 | 0.85 |
| Glucose | 1.61 | 1.23 |
| Glucose | 1.98 | 1.60 |
| LDL | 5.95 | 2.53 |
| LDL | 4.94 | 1.57 |
| Triglycerides | 0.78 | 0.77 |
| Triglycerides | 0.83 | 1.61 |
| Uric Acid | 0.03 | 2.78 |
| Uric Acid | 0.39 | 2.68 |
| Urea Nitrogen | 1.51 | 3.44 |
| Urea Nitrogen | 1.55 | 3.52 |
and now for the second instrument...
| Roche cobas c702 - Instrument 2 | ||
| TEST | % Bias | CV |
| Iron | 3.58 | 2.34 |
| Iron | 1.52 | 1.90 |
| Bilirubin Direct | 2.57 | 1.95 |
| Bilirubin Direct | 6.01 | 2.63 |
| Bilirubin Total | 0.68 | 3.84 |
| Bilirubin Total | 0.52 | 2.88 |
| Calcium | 0.45 | 1.79 |
| Calcium | 0.29 | 1.75 |
| Sodium | 0.72 | 2.19 |
| Sodium | 3.65 | 1.56 |
| Potassium | 0.00 | 2.26 |
| Potassium | 4.51 | 1.37 |
| Chloride | 3.21 | 2.47 |
| Chloride | 3.66 | 2.16 |
| HDL | 5.01 | 3.41 |
| HDL | 1.60 | 2.09 |
| ALT | 0.33 | 4.66 |
| ALT | 0.48 | 1.96 |
| AST | 1.30 | 3.38 |
| AST | 1.52 | 2.25 |
| Cholesterol | 0.31 | 1.85 |
| Cholesterol | 0.38 | 2.65 |
| Creatinine | 1.02 | 2.52 |
| Creatinine | 0.75 | 2.38 |
| Glucose | 0.00 | 1.59 |
| Glucose | 0.40 | 1.53 |
| LDL | 0.00 | 1.28 |
| LDL | 1.57 | 1.20 |
| GGT | 1.79 | 1.94 |
| GGT | 3.19 | 1.78 |
| Triglycerides | 2.34 | 1.83 |
| Triglycerides | 3.77 | 2.73 |
| Uric Acid | 0.21 | 3.07 |
| Uric Acid | 0.89 | 2.52 |
| Urea Nitrogen | 3.77 | 4.31 |
| Urea Nitrogen | 4.09 | 4.07 |
Sigma-metrics according to EFLM-derived MINIMUM performance specifications
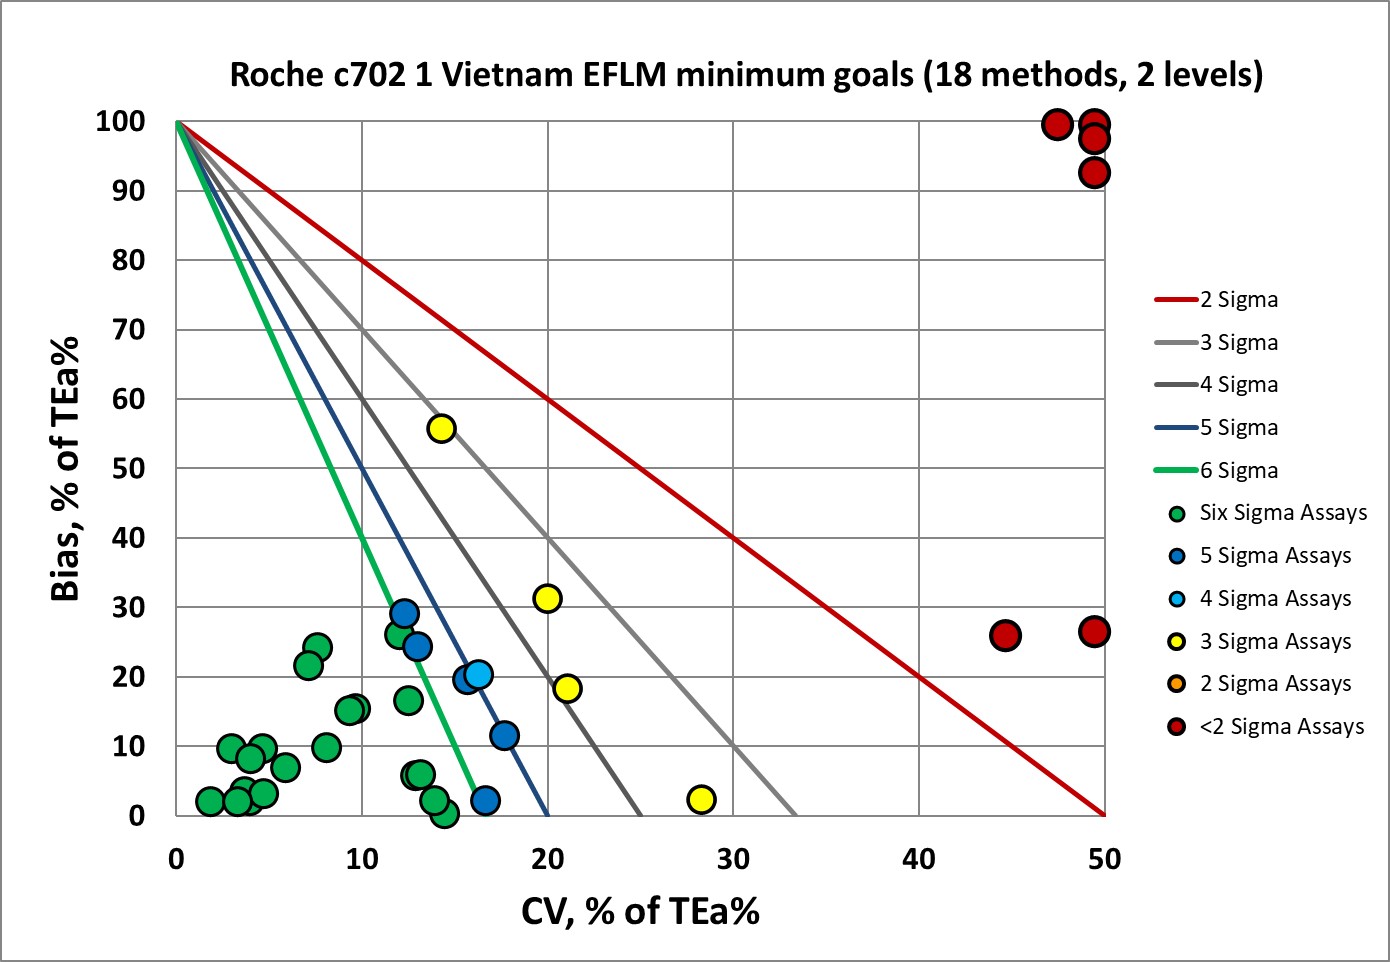
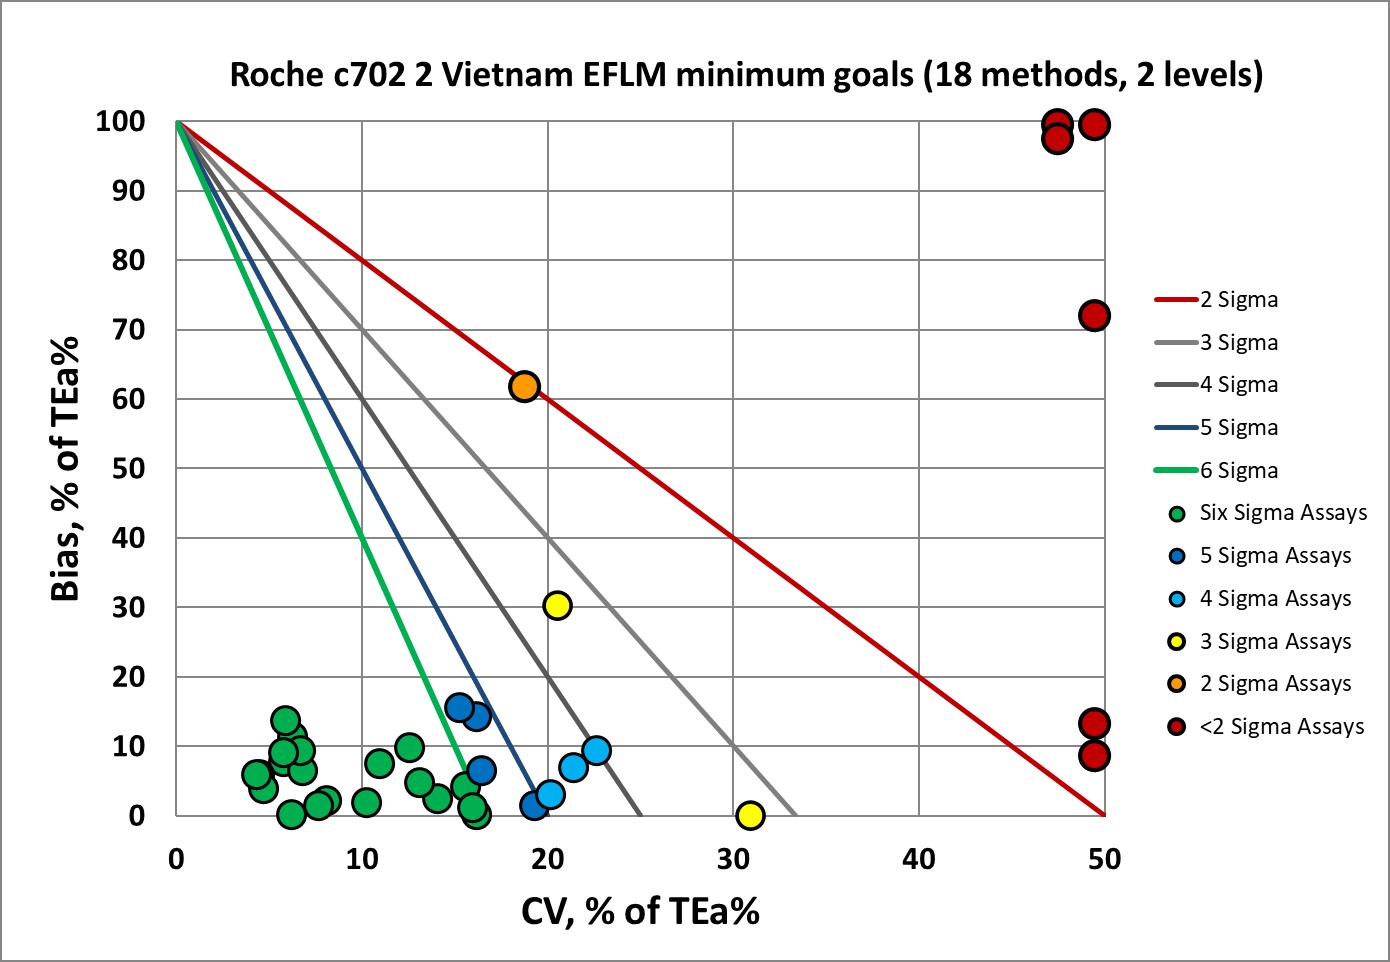
Believe it or not, these new EFLM goals give the best grade to the c702s, a full majority of the performance at Six Sigma. But what draws they eye, of course, are the red dots, where the EFLM goals for electrolytes like calcium, chloride, potassium, and sodium, are punishingly small, even at the minimum setting. Not surprising that a recent paper suggests sodium performance specifications should not be based on biological variation.
Sigma-metrics according to EuBIVAS-derived DESIRABLE performance specifications
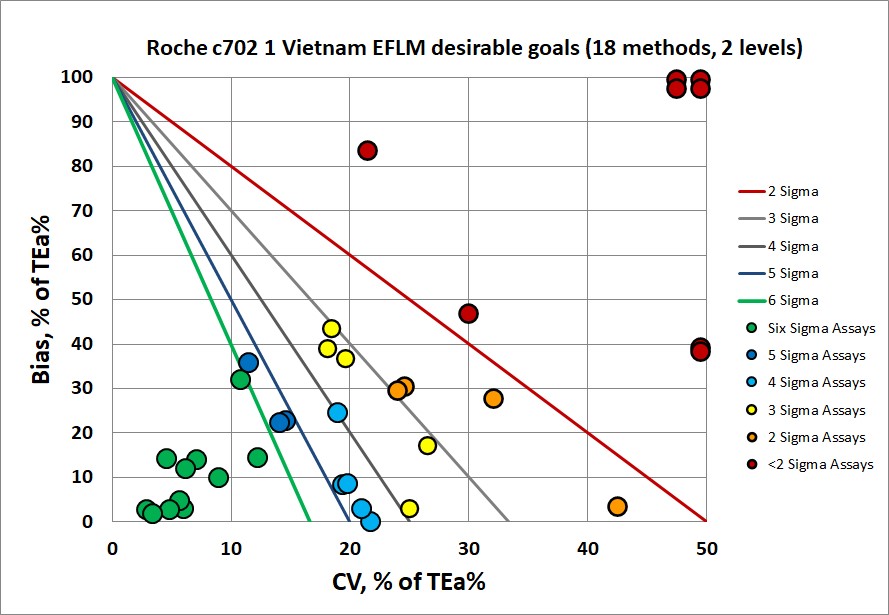
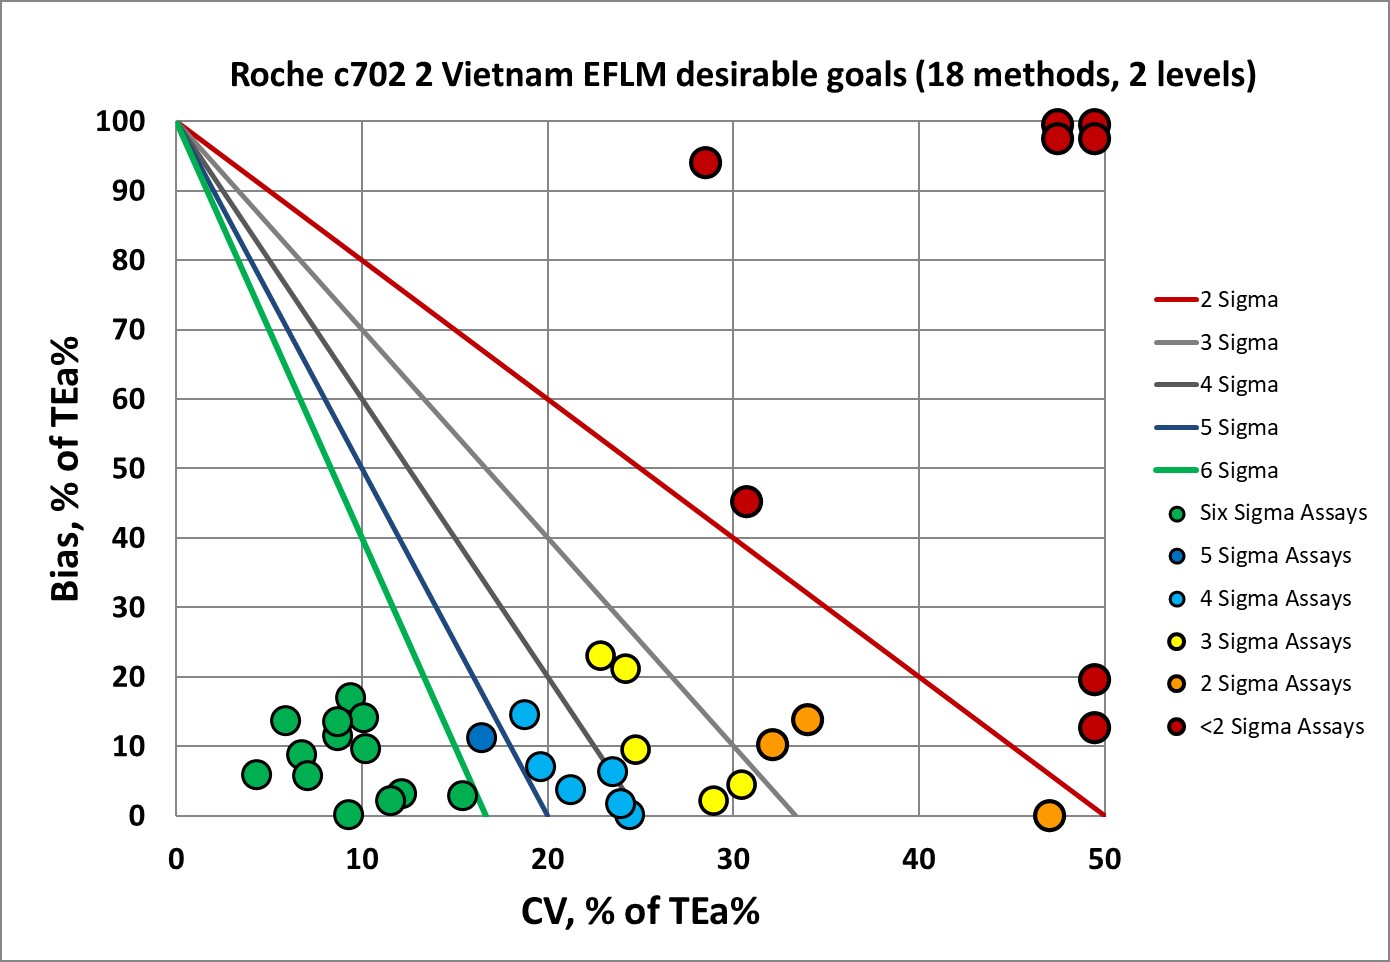
When you see this evaluation, it's not surprising that EFLM recommended lowering the standards. When desirable specifications are applied, about a third of the performance remains in the bull's-eye, but a third of the performance is now below 3 Sigma (orange and red dots). Of course, the tough standards on the electrolytes are even tougher in this scenario, with performance falling further off the graph.
What about performance using the old CLIA goals?
Sigma-metrics according to CLIA 1992 performance specifications
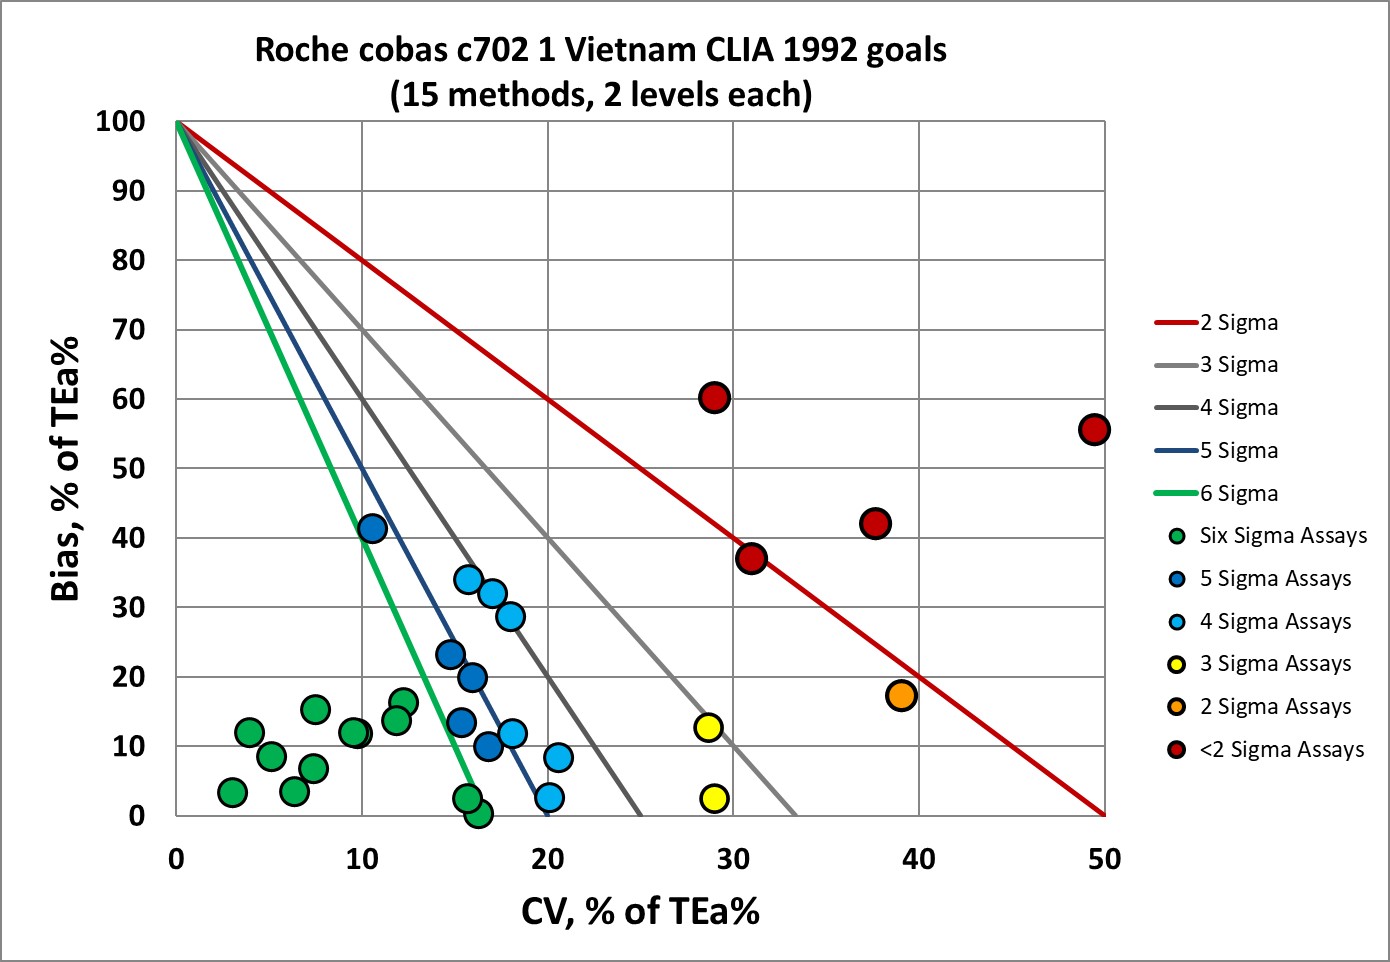
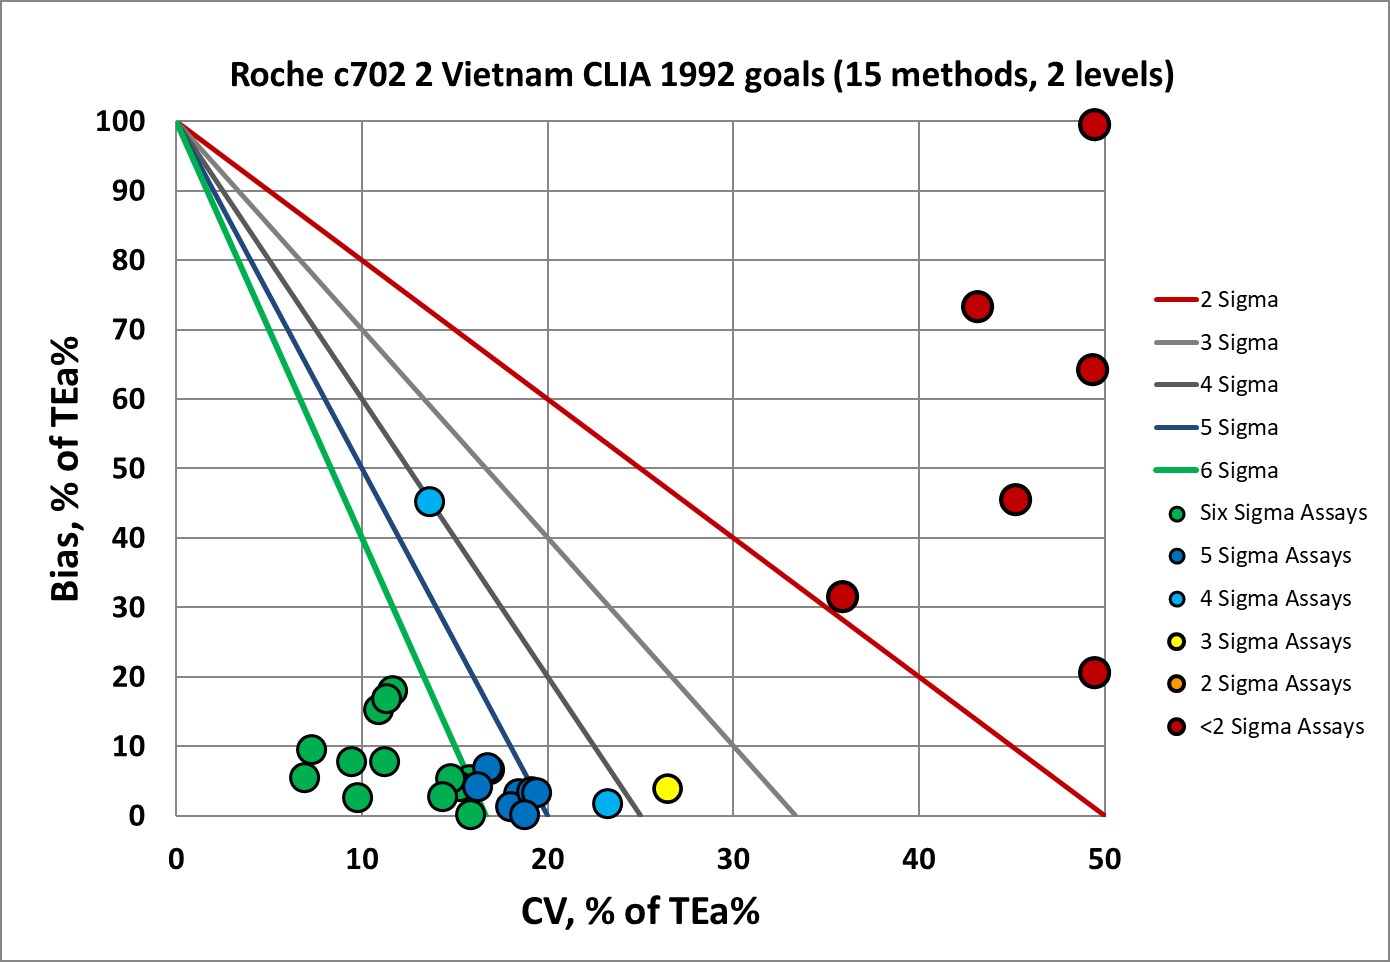
Now, some of the assays of the study are not covered by CLIA 1992, so we have fewer dots on the plot. But those that are enjoy fewer bad rankings. Only 16-20% of the performance is below 3 Sigma here (again, led by the electrolytes).
And the new CLIA goals?
Sigma-metrics according to CLIA 2024 performance specifications
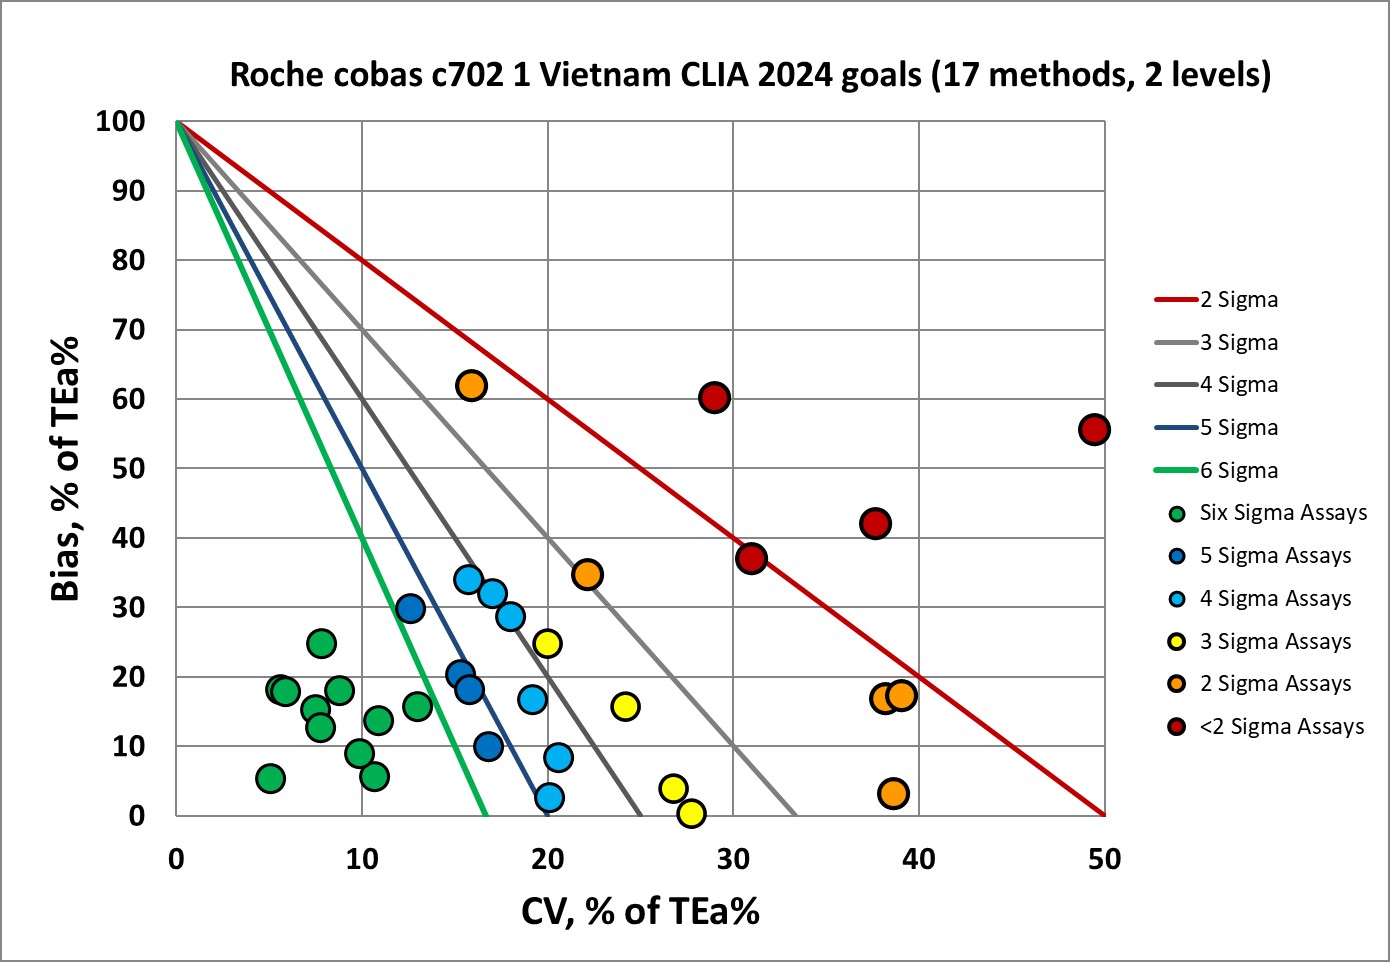
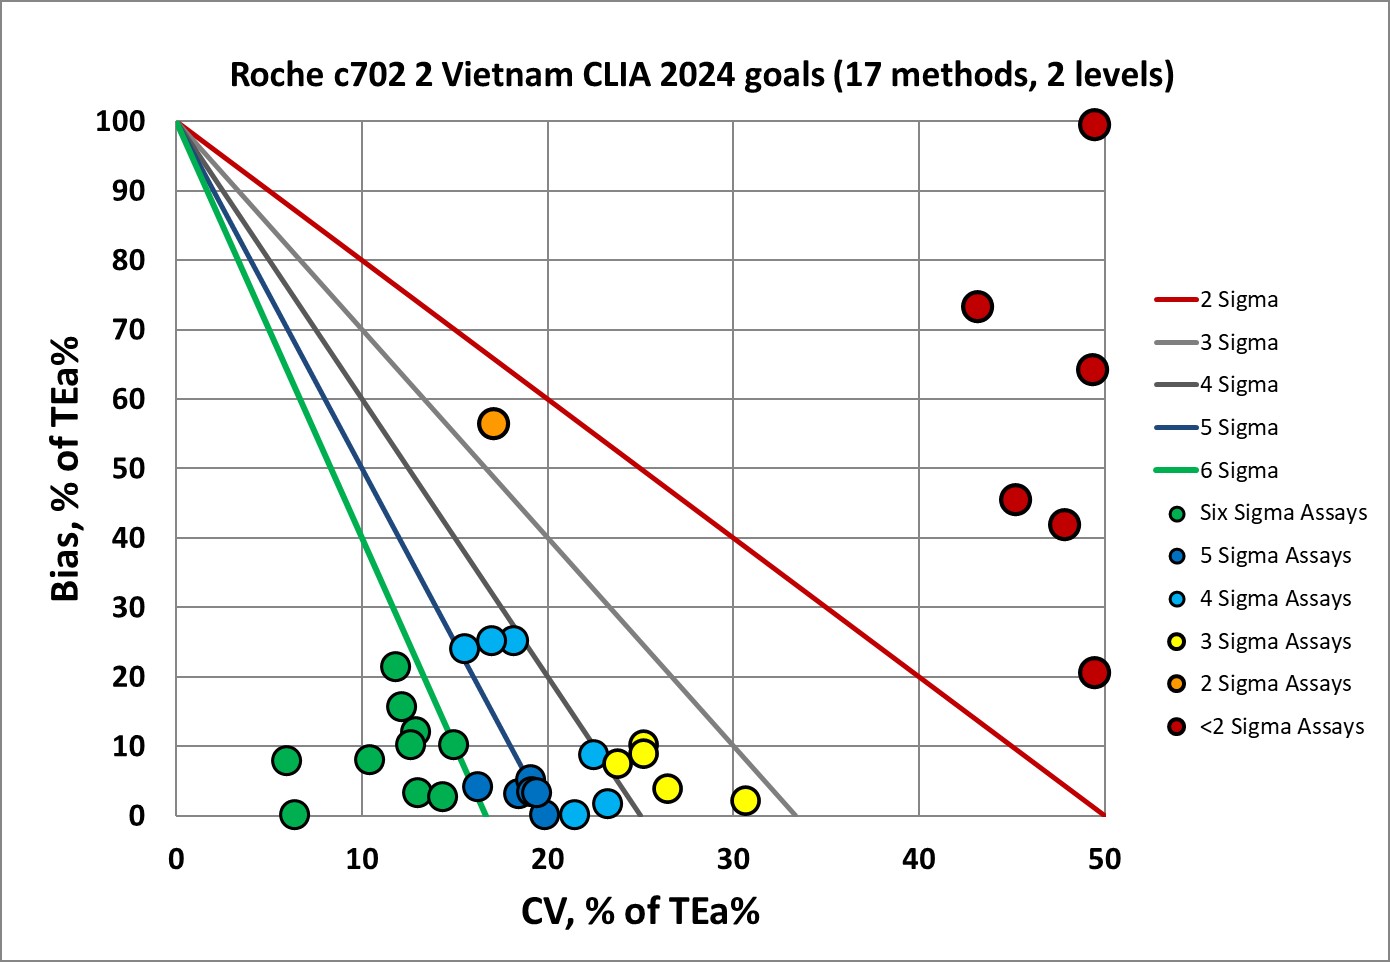
The CLIA 2024 goals cover more assays, we see about 30-32% of the performance in the bull's-eye, and 20-26% of the performance below 3 Sigma. Useful to note that the CLIA 2024 goals for electrolytes are mostly the same as they were in 1992.
Conclusion
No matter what set of benchmarks are used, the electrolytes for these two cobas c702's is not up to snuff. There's a fair amount of good news, but enough concerning news to indicate these aren't the best instruments in the world. The two instruments demonstrated reasonable consistency - bad assays on one instrument were also bad on the other, and Six Sigma assays on one instrument were generally Six Sigma on the other instrument as well.
CLIA 2024 goals continue to emerge as a the most appropriate set of performance specifications for the modern era. EFLM, whether minimum or desirable, are either too tight, too loose, when applied to all assays. It's becoming clear that labs should select EFLM goals carefully and sparingly.