Sigma Metric Analysis
Alinity hq in Netherlands, Multimode analysis
Continuing in our analysis of hematology systems, we look at the impact of new CLIA and EFLM goals on the assessment of Alinity hq hematology analyzers in the Netherlands.
Alinity hq hematology analyzers in the Netherlands, multimode analysis
September 2023
Sten Westgard, MS
See the other analyses in this series:
- Beckman Coulter DxC 700
- Abbott Alinity
- Siemens Atellica
- Siemens Atellica in Romania
- Siemens Atellica in Spain
- Siemens ADVIA 2120i
- Roche c501 in Turkey
- Roche c501 in Saudi Arabia
- MicroLab RX-50 in India
- Roche cobas 6000 immunoassays in Turkey
- Sysmex XN 350 in India
- Dymind DH 76 in Bulgaria
- Mindray 7500 in China
- Mindray BS 2000M in China
This Alinity hq data comes from several labs in the Netherlands:
Multicenter performance evaluation of the Abbott Alinity hq hematology analyzer, Slim CL, Wevers BA, Demmers MWHJ, Lakos G, Hoffmann JJML, Adriaasen HJ, Kooren JA, Storm H. CCLM 57(10) https://www.degruyter.com/document/doi/10.1515/cclm-2019-0155/html
"Within-laboratory precision (i.e. total precision) experiments were performed using three levels of controls (CELL-DYN 29 Plus Control, with reticulocytesl Abbott). Controls were tested for 5 consecutive days with four repetitions per day. Each laboratory used a different lot of controls; therefore, precision was calcualted for each site separately."
"Samples were selected over a period of 3 months, based on CELL-DYN Sapphire results or diagnosis, ensuring inclusion of a wide range of pathologies. Altogether 1473 samples were included into the clinical cohort....Passing and Bablok regression and Bland-Altman evaluation were used to assess the correlation and agreement between CELL-DYN Sapphire and Alniity hq results, and between manual and automated WBC differential..."
The use of manufacturer controls are a weakness of this study, as they are less likely to provide an honest, independent assessment of the performance of the instrument. But in hematology, as we've seen before, it's far less common to use a 3rd party control.
The study gives a range of CV values from the 3 laboratories, so here we average that range for one precision estimate. There are three levels that will be analyzed here. So for 13 parameters there will be 39 data points to plot on the Normalized Method Decision Chart. Note that while the EFLM biological variation database contains performance specifications for MCV, MCHC, and all the differential paraments, the CLIA 1992 and CLIA 2024 goals do not. Thus, the graphs for CLIA will only cover 5 parameters and 15 data points. The extra wrinkle is that the Abbott hematology methods have a CV61 method of determining platelet count.
The TEa goals applied can be found on our Consolidated Hematology Performance Specifications page.
| TEST | Level | Slope | Y-int | % Bias | AVG %CV |
| Hemoglobin | 4.70 | 1.03 | -0.31 | 3.6 | 1.14 |
| 7.31 | 1.03 | -0.31 | 1.2 | 0.68 | |
| 10.30 | 1.03 | -0.31 | 0.0 | 0.63 | |
| Hematocrit | 0.23 | 1.05 | -1.83 | 790.7 | 1.23 |
| 0.35 | 1.05 | -1.83 | 517.9 | 1.44 | |
| 0.50 | 1.05 | -1.83 | 361.0 | 1.60 | |
| MCV | 82.10 | 1.09 | -7.89 | 0.6 | 0.83 |
| 83.50 | 1.09 | -7.89 | 0.4 | 0.83 | |
| 94.60 | 1.09 | -7.89 | 0.7 | 0.67 | |
| Platelets | 68.60 | 0.95 | 1.57 | 2.7 | 3.33 |
| 221.00 | 0.95 | 1.57 | 4.3 | 1.79 | |
| 490.00 | 0.95 | 1.57 | 4.7 | 1.66 | |
| Platelets CD61 | 68.60 | 0.90 | 3.78 | 4.5 | 3.33 |
| 221.00 | 0.90 | 3.78 | 8.3 | 1.79 | |
| 490.00 | 0.90 | 3.78 | 9.2 | 1.66 | |
| RBC | 2.84 | 1.02 | -0.10 | 1.5 | 0.87 |
| 4.19 | 1.02 | -0.10 | 0.4 | 1.01 | |
| 5.23 | 1.02 | -0.10 | 0.1 | 1.18 | |
| WBC | 3.11 | 0.99 | -0.03 | 2.0 | 2.48 |
| 7.06 | 0.99 | -0.03 | 1.4 | 1.72 | |
| 16.20 | 0.99 | -0.03 | 1.2 | 1.07 | |
| Lymphocytes | 0.92 | 0.99 | -0.04 | 5.3 | 4.23 |
| 1.86 | 0.99 | -0.04 | 3.2 | 3.47 | |
| 3.65 | 0.99 | -0.04 | 2.1 | 2.17 | |
| Monocytes | 0.33 | 1.00 | 0.01 | 3.0 | 8.31 |
| 0.72 | 1.00 | 0.01 | 1.4 | 5.94 | |
| 1.75 | 1.00 | 0.01 | 0.6 | 4.05 | |
| Eosinophils | 0.07 | 1.04 | -0.01 | 10.3 | 14.95 |
| 0.18 | 1.04 | -0.01 | 1.6 | 9.80 | |
| 0.44 | 1.04 | -0.01 | 1.7 | 5.83 | |
| Basophils | 0.03 | 0.70 | 0.00 | 30.0 | 27.10 |
| 0.07 | 0.70 | 0.00 | 30.0 | 18.15 | |
| 0.15 | 0.70 | 0.00 | 30.0 | 13.57 | |
| Neutrophils | 1.40 | 0.99 | -0.01 | 1.7 | 3.82 |
| 3.38 | 0.99 | -0.01 | 1.3 | 2.66 | |
| 8.07 | 0.99 | -0.01 | 1.1 | 1.89 |
Sigma-metrics according to EFLM-derived DESIRABLE performance specifications
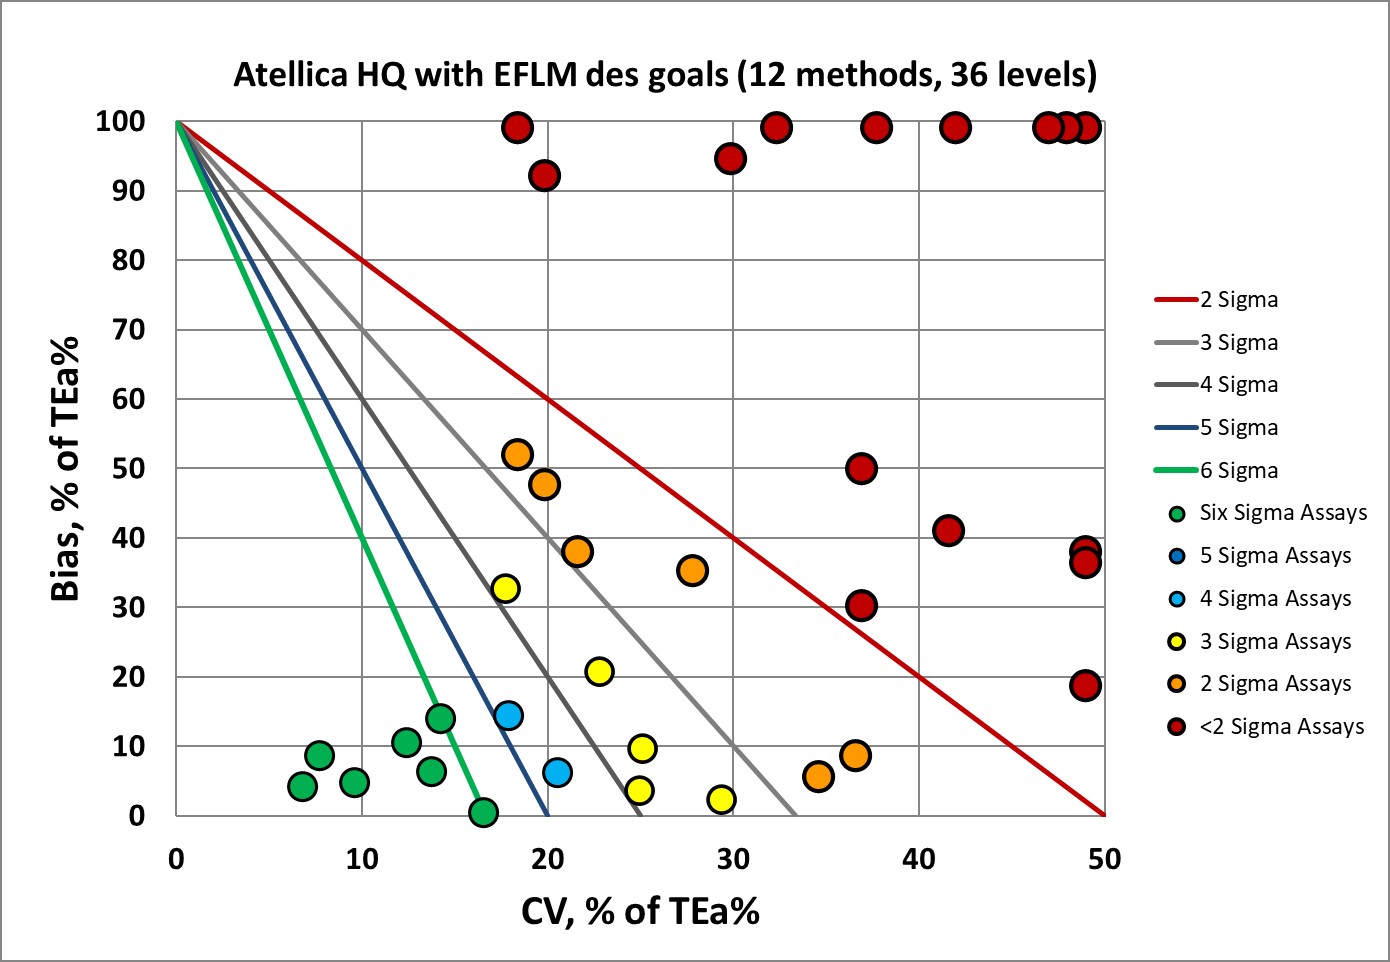
Let's start with the most stringest goals. The EFLM desirable specifications used to be the de facto global standard, but have fallen out of favor due to their severity. EFLM's desirable biological variation goals are the toughest there are.
For Alinity hq, over 70% of the assay performance is in the 3 Sigma or worse zones.
No wonder EFLM recommends using the minimum performance specifications, not the desirable. So how does that look?
Sigma-metrics according to EFLM biological variation MINIMUM performance specifications
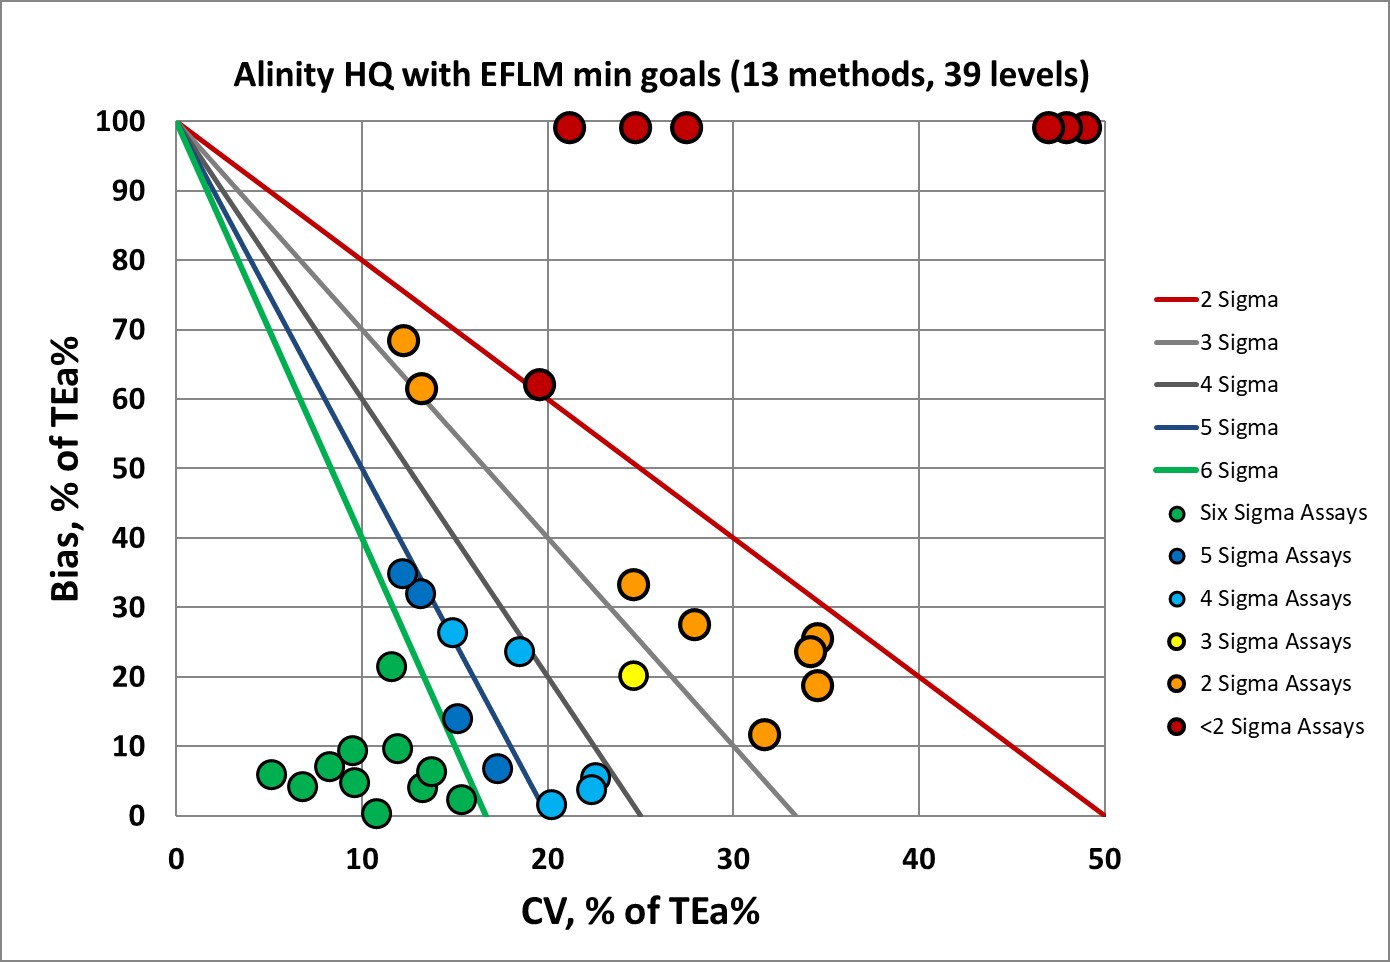
It's a big improvement, now less than 50% of the performance is 3 Sigma and lower. Almost 30% of the performance achieves 6 Sigma.
Hematocrit and Basophils are the worst offenders, but if we're honest, no one on the market really has a good Basophil count (if we're using biological variation goals). The MCV is also a poor performing parameter.
Here's one of the most interesting new aspects of CLIA's new 2024 goals. Are they more or less demanding than EFLM goals?
Sigma-metrics according to CLIA 2024 performance specifications
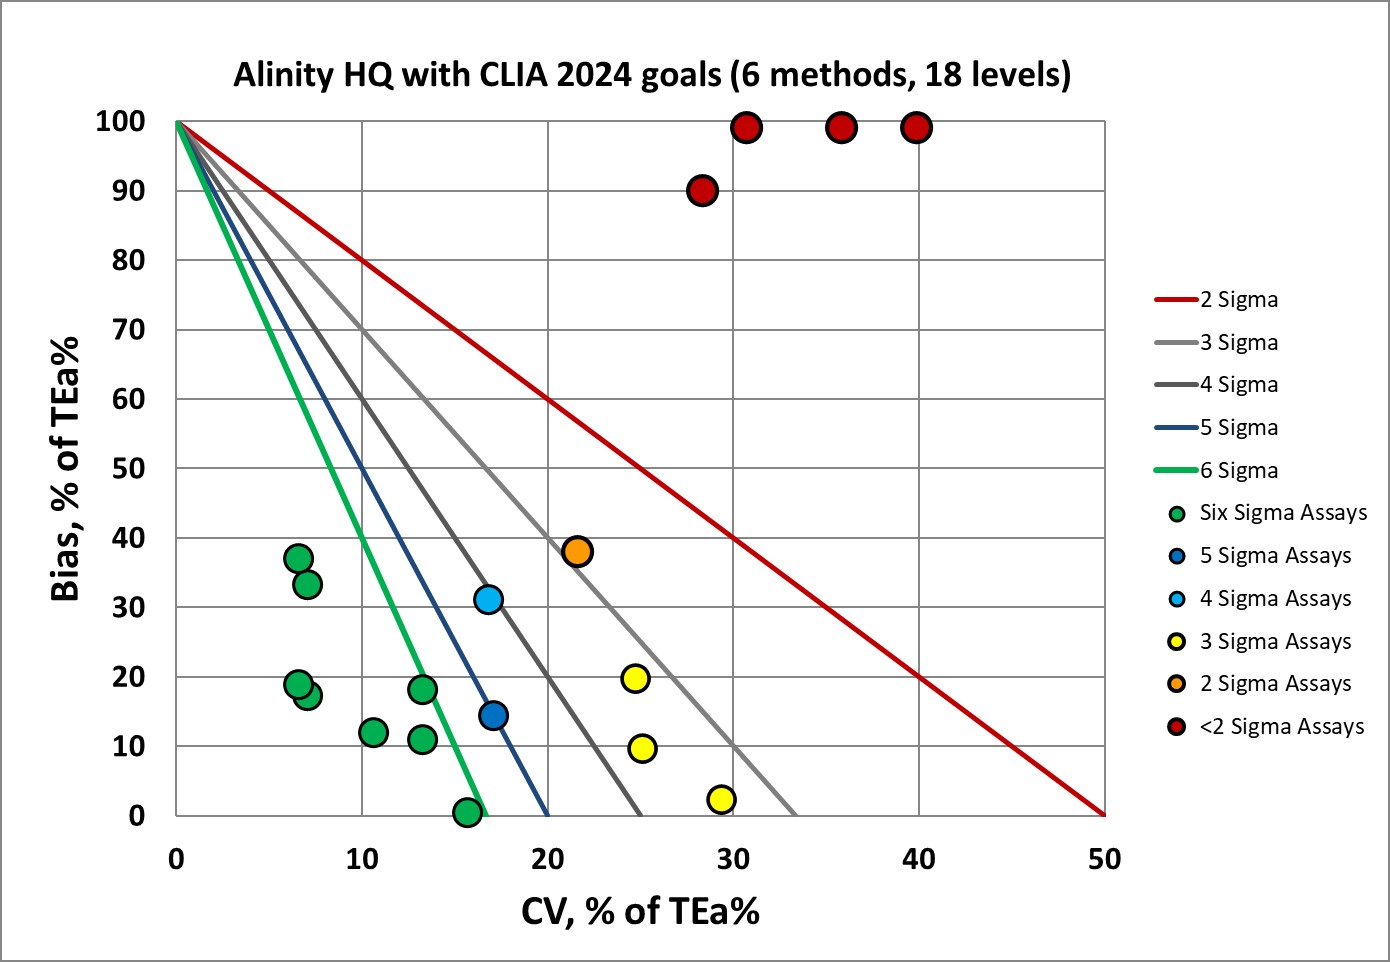
The CLIA 2024 goals much easier on the Alinity hq, with only about 25% of the performance at 3 Sigma or below. Hematocrit and RBC and the lowest level of Hemoglobin are the assays with weakest performance. Of course, since CLIA doesn't regulate the differential counts, we don't see any grading of that performance here.
Just for a complete look, let's see how the oldest goals would have graded the Alinity hq.
Sigma-metrics according to CLIA 1992 performance specifications
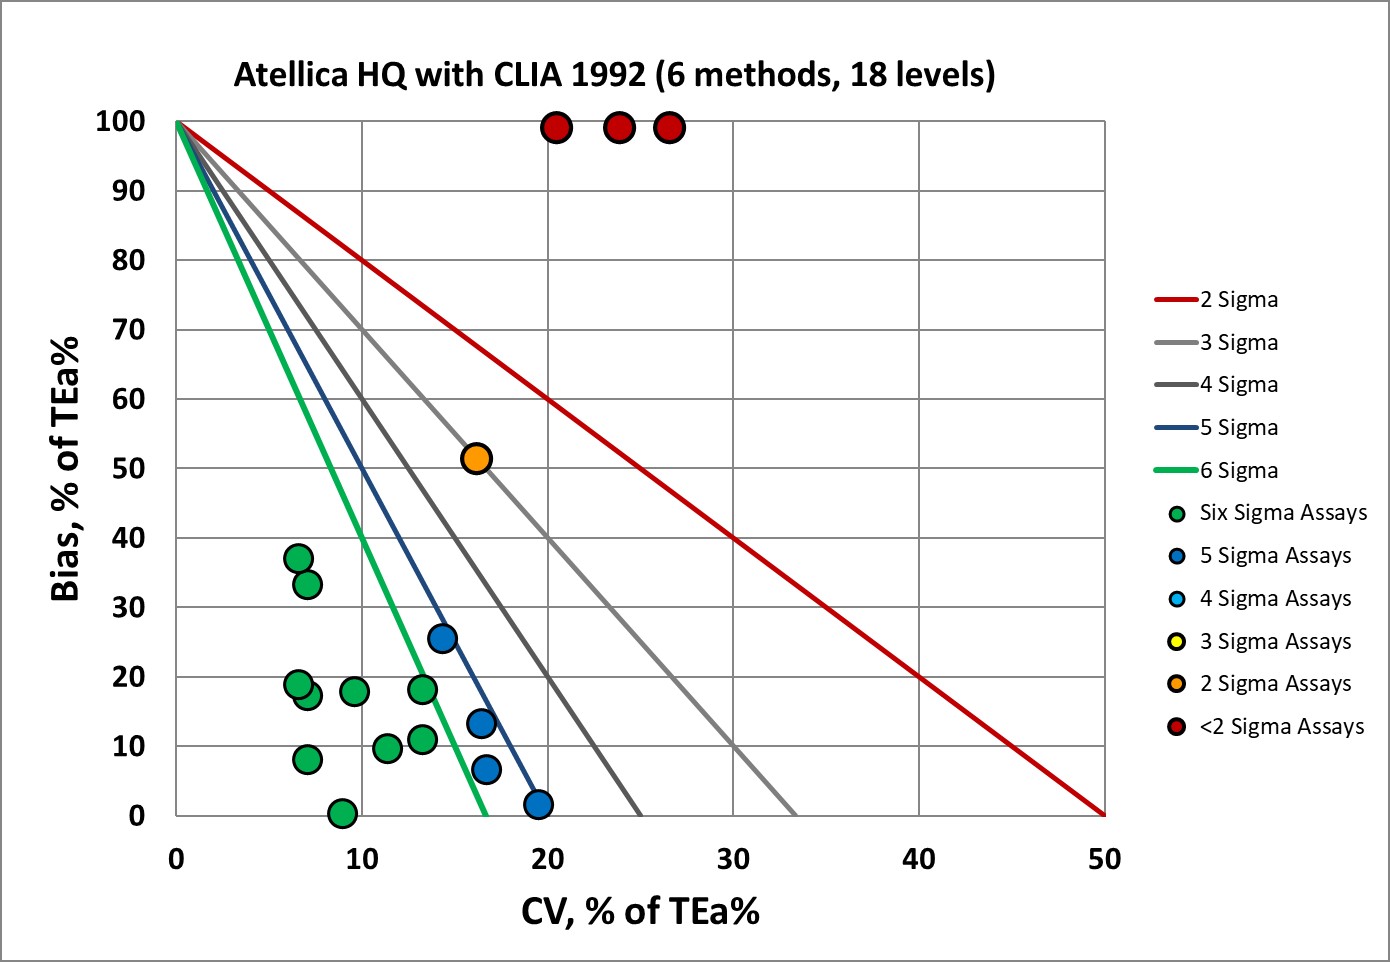
If we apply the CLIA 1992 goals, it's the most favorable review. The most number of 6 Sigma analytes occur when these performance specifications are used. Over 55% of the performance is in the Bull's-eye. But no set of goals gives Alinity hq a perfect grade. Hematocrit remains a problem parameter, no matter which goal is used.
Conclusion
This is yet one more analysis showing that the current set of goals for hematology, from both CLIA and EFLM, are not in synch with today's hematology analyzers. For differential counts, the biological performance specifications may be unrealistic to achieve, yet there's no real other alternative. CLIA 2024's new goals are probably the best balance of stringency and permissiveness.