Sigma Metric Analysis
Multimode Sigma metric analysis of a cobas 8000
Taking some recent cobas 8000 data, we assess what goals can be achieved by one of the leading chemistry platforms.
Sigma metric analysis of a cobas 8000 - benchmarking with multiple goals
December 2019
Sten Westgard, MS
After our recent analysis of the Siemens Atellica using the latest sets of performance specifications
(EFLM, Ricos, CLIA 2019, CLIA 1992, and Westgard Sigma VP), we decided to expand the scope of our benchmarking to the other major instruments as well.
See the other analyses in this series:
- Beckman Coulter DxC 700
- Abbott Alinity
- Siemens Atellica
- Siemens Atellica in Romania
- Siemens Atellica in Spain
- Siemens ADVIA 2120i
- Roche c501 in Turkey
- Roche c501 in Saudi Arabia
- MicroLab RX-50 in India
- Roche cobas 6000 immunoassays in Turkey
- Sysmex XN 350 in India
- Mindray 7500 in China
- Mindray BS 2000M in China
With that in mind, we're taking advantage of some cobas 8000 data frm a real-world data. One wrinkle: this data is not published, it's the routine cumulative performance data from a US lab, the lab is anonymous, the controls are 3rd party Bio-Rad, the imprecision is cumulative, the bias is taken from the Unity peer group program (lab's mean compared against the peer group mean). The reason for selecting this data - too many of the studies out there for Roche employ the manufacturer controls. As ISO 15189 recommends, 3rd party controls are the most appropriate choice. It's well known that manufacturer controls often provide an overly optimized view of instrument performance.
The raw data of imprecision and bias
|
TEST |
Peer Mean |
Lab Mean |
% Bias |
% CV |
|
Albumin |
2.56 |
2.53 |
1.2 |
3.6 |
|
Albumin |
4.59 |
4.56 |
0.65 |
2.9 |
|
Alk Phos |
31.15 |
31.09 |
0.2 |
4.6 |
|
Alk Phos |
277.00 |
278.00 |
0.36 |
3.0 |
|
ALT |
26.15 |
25.98 |
0.7 |
3.9 |
|
ALT |
181.90 |
182.70 |
0.44 |
2.4 |
|
Amylase |
42.85 |
43.26 |
1.0 |
2.0 |
|
Amylase |
273.90 |
273.10 |
0.29 |
2.0 |
|
AST |
39.60 |
39.60 |
0.0 |
2.3 |
|
AST |
258.90 |
257.70 |
0.46 |
1.9 |
|
Bilirubin, Direct |
0.21 |
0.22 |
5.7 |
6.1 |
|
Bilirubin, Direct |
1.90 |
1.91 |
0.53 |
3.5 |
|
Bilirubin, Total |
0.55 |
0.56 |
1.4 |
5.1 |
|
Bilirubin, Total |
6.60 |
6.75 |
2.27 |
1.8 |
|
Calcium |
6.19 |
6.21 |
0.3 |
2.8 |
|
Calcium |
13.22 |
13.17 |
0.38 |
1.8 |
|
Chloride |
73.06 |
72.98 |
0.1 |
1.4 |
|
Chloride |
117.80 |
117.70 |
0.08 |
0.7 |
|
Cholesterol |
109.40 |
111.90 |
2.3 |
2.5 |
|
Cholesterol |
273.40 |
279.10 |
2.08 |
2.0 |
|
CO2 |
16.10 |
16.33 |
1.4 |
5.4 |
|
CO2 |
25.21 |
25.85 |
2.54 |
5.4 |
|
Creatinine Kinase (CK) |
77.10 |
78.58 |
1.9 |
2.5 |
|
Creatinine Kinase (CK) |
619.00 |
635.00 |
2.58 |
1.5 |
|
Creatinine |
0.88 |
0.88 |
0.2 |
3.0 |
|
Creatinine |
6.74 |
6.74 |
0.00 |
1.6 |
|
Glucose |
57.42 |
57.40 |
0.0 |
1.7 |
|
Glucose |
359.00 |
358.60 |
0.11 |
1.6 |
|
HDL |
23.88 |
23.98 |
0.4 |
1.8 |
|
HDL |
54.71 |
54.72 |
0.02 |
2.4 |
|
Lactate |
1.44 |
1.43 |
0.7 |
1.7 |
|
Lactate |
5.65 |
5.61 |
0.71 |
1.9 |
|
Lipase |
24.06 |
24.96 |
3.7 |
4.3 |
|
Lipase |
5.65 |
5.61 |
0.71 |
1.9 |
|
Magnesium |
1.12 |
1.13 |
0.9 |
3.7 |
|
Magnesium |
4.14 |
4.19 |
1.21 |
2.0 |
|
Phosphorous |
1.95 |
1.98 |
1.5 |
2.8 |
|
Phosphorous |
7.20 |
7.29 |
1.25 |
2.0 |
|
Potassium |
2.63 |
2.63 |
0.0 |
0.9 |
|
Potassium |
7.72 |
7.71 |
0.13 |
0.6 |
|
Protein, Total |
3.98 |
3.96 |
0.5 |
2.2 |
|
Protein, Total |
6.93 |
6.86 |
1.01 |
2.0 |
|
Sodium |
117.40 |
117.70 |
0.3 |
0.7 |
|
Sodium |
160.40 |
160.10 |
0.19 |
0.5 |
|
Triglycerides |
88.55 |
91.44 |
3.3 |
2.0 |
|
Triglycerides |
203.80 |
207.40 |
1.77 |
1.7 |
|
Urea Nitrogen |
14.60 |
14.61 |
0.1 |
5.0 |
|
Urea Nitrogen |
68.69 |
70.38 |
2.46 |
3.7 |
|
Uric Acid |
3.51 |
3.66 |
4.3 |
2.0 |
|
Uric Acid |
9.56 |
9.82 |
2.72 |
2.0 |
Now, the next thing to do is take a look at the latest EFLM performance specifications, as derived from the EuBIVAS biological variation database; Ricos 2014 performance specifications; Westgard Sigma VP program performance specifications; proposed CLIA 2019 goals; and finally the current 1992 CLA goals.
Please note that the number of assays will vary from table to table, since not all assays are covered by the latest EuBIVAS database, nor by the CLIA goals. That makes the comparison slightly uneven - but it's a comparison of slightly different sizes of apples, not entirely different fruits
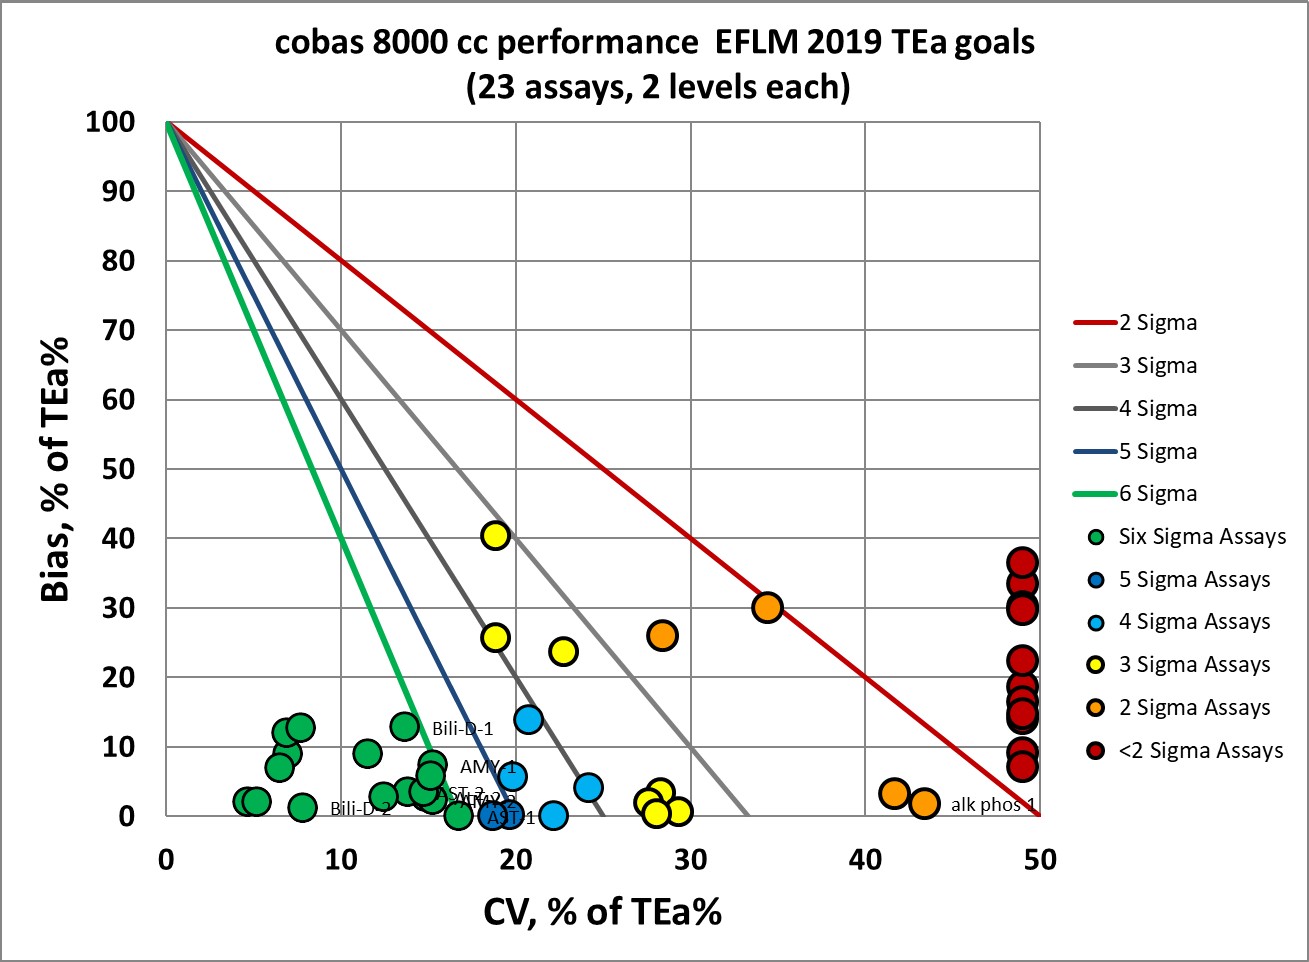
Sigma-metrics according to EuBIVAS-derived desirable performance specifications (as of December 2019)
If you're looking for the toughest set of specifications, this is it. More than half of the assay performance is located at 3 Sigma and below, while just over a third of performance is at 6 Sigma. That's the most worst and the least best in our comparison.
|
TEST |
EuBIVAS 2019 TEa |
% Bias |
CV |
Sigma-Metric |
|
Albumin |
3.5 |
1.2 |
3.6 |
0.6 |
|
Albumin |
3.5 |
0.65 |
2.9 |
1.0 |
|
Alk Phos |
10.6 |
0.2 |
4.6 |
2.3 |
|
Alk Phos |
10.6 |
0.36 |
3.0 |
3.4 |
|
ALT |
16.1 |
0.7 |
3.9 |
4.0 |
|
ALT |
16.1 |
0.44 |
2.4 |
>6 |
|
Amylase |
13.1 |
1.0 |
2.0 |
>6 |
|
Amylase |
13.1 |
0.29 |
2.0 |
>6 |
|
AST |
13.7 |
0.0 |
2.3 |
6.0 |
|
AST |
13.7 |
0.46 |
1.9 |
>6 |
|
Bilirubin, Direct |
44.50 |
5.7 |
6.1 |
>6 |
|
Bilirubin, Direct |
44.50 |
0.53 |
3.5 |
>6 |
|
Bilirubin, Total |
25.70 |
1.4 |
5.1 |
4.8 |
|
Bilirubin, Total |
25.70 |
2.27 |
1.8 |
>6 |
|
Calcium |
2.3 |
0.3 |
2.8 |
0.7 |
|
Calcium |
2.3 |
0.38 |
1.8 |
1.1 |
|
Chloride |
1.2 |
0.1 |
1.4 |
0.8 |
|
Chloride |
1.2 |
0.08 |
0.7 |
1.6 |
|
Cholesterol |
8.8 |
2.3 |
2.5 |
2.6 |
|
Cholesterol |
8.8 |
2.08 |
2.0 |
3.4 |
|
Creatinine Kinase (CK) |
21.6 |
1.9 |
2.5 |
>6 |
|
Creatinine Kinase (CK) |
21.6 |
2.58 |
1.5 |
>6 |
|
Creatinine |
7.20 |
0.2 |
3.0 |
2.3 |
|
Creatinine |
7.20 |
0.00 |
1.6 |
4.5 |
|
Glucose |
5.80 |
0.0 |
1.7 |
3.4 |
|
Glucose |
5.80 |
0.11 |
1.6 |
3.6 |
|
HDL |
12.20 |
0.4 |
1.8 |
>6 |
|
HDL |
12.20 |
0.02 |
2.4 |
5.1 |
|
Lactate |
36.20 |
0.7 |
1.7 |
>6 |
|
Lactate |
36.20 |
0.71 |
1.9 |
>6 |
|
Lipase |
12.50 |
3.7 |
4.3 |
2.0 |
|
Lipase |
12.50 |
0.71 |
1.9 |
>6 |
|
Magnesium |
4.00 |
0.9 |
3.7 |
0.8 |
|
Magnesium |
4.00 |
1.21 |
2.0 |
1.4 |
|
Potassium |
4.8 |
0.0 |
0.9 |
5.3 |
|
Potassium |
4.8 |
0.13 |
0.6 |
>6 |
|
Protein, Total |
3.4 |
0.5 |
2.2 |
1.3 |
|
Protein, Total |
3.4 |
1.01 |
2.0 |
1.2 |
|
Sodium |
0.7 |
0.3 |
0.7 |
0.6 |
|
Sodium |
0.7 |
0.19 |
0.5 |
1.0 |
|
Triglycerides |
25.90 |
3.3 |
2.0 |
>6 |
|
Triglycerides |
25.90 |
1.77 |
1.7 |
>6 |
|
Urea Nitrogen |
17.80 |
0.1 |
5.0 |
3.5 |
|
Urea Nitrogen |
17.80 |
2.46 |
3.7 |
4.1 |
|
Uric Acid |
10.60 |
4.3 |
2.0 |
3.2 |
|
Uric Acid |
10.60 |
2.72 |
2.0 |
3.9 |
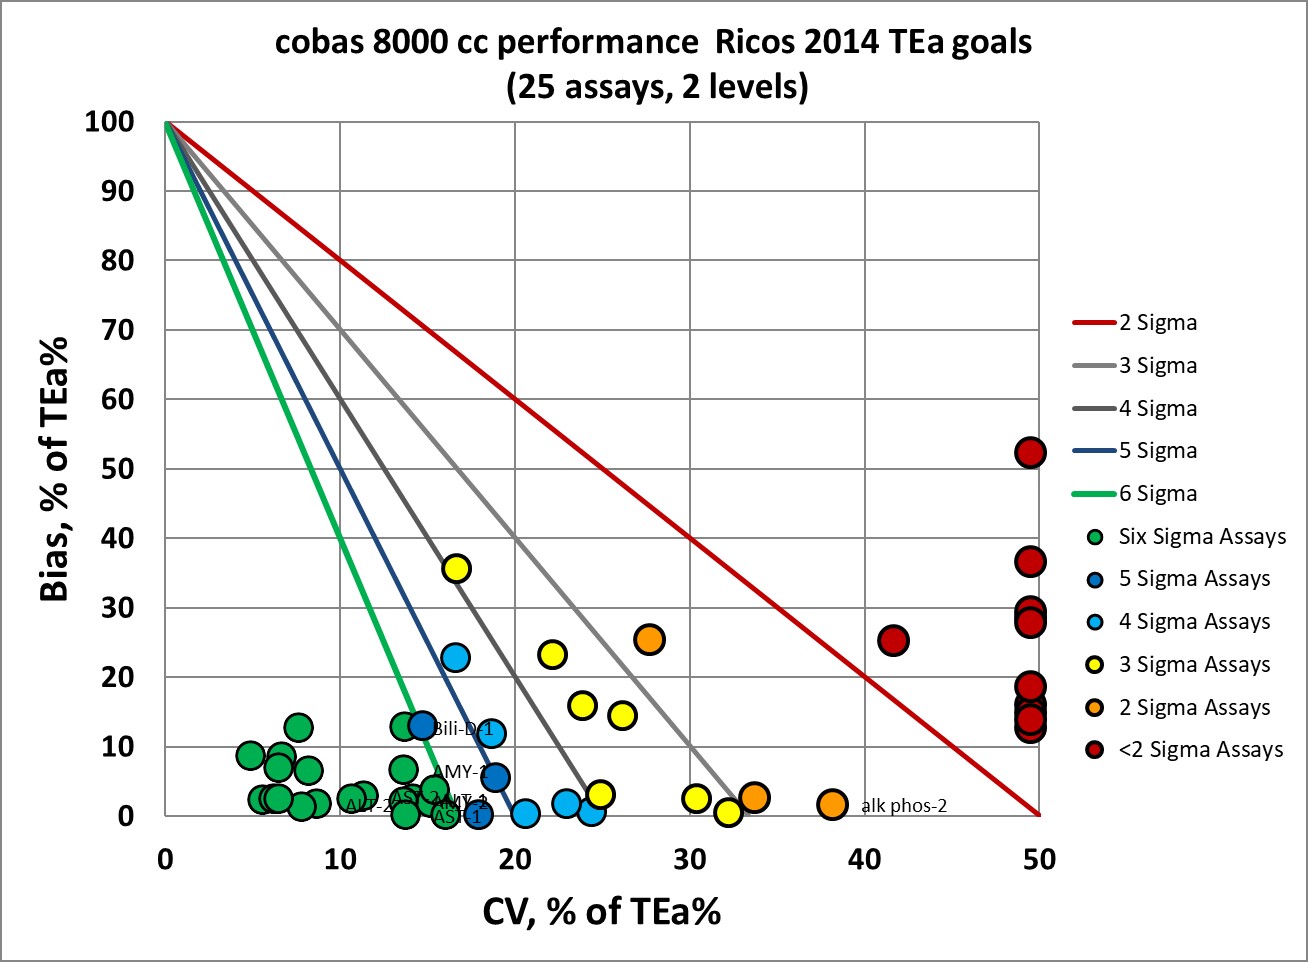
Next, we can look at the "original" version of the biological variation database. The last version of the database was updated in 2014 by Ricos et al, so we refer to these performance specifications as Ricos 2014 goals.
Sigma-metrics according to Ricos 2014 desirable performance specifications
The original Ricos goals are not quite as hard on this cobas 8000. 40% of the assay performance achieves 6 Sigma, but 44% is at 3 Sigma and below. But this is still considerably far from desirable.
|
TEST |
Ricos 2014 TEa |
% Bias |
CV % |
Sigma-metric |
|
Albumin |
4.1 |
1.2 |
3.6 |
0.8 |
|
Albumin |
4.1 |
0.65 |
2.9 |
1.2 |
|
Alk Phos |
12.04 |
0.2 |
4.6 |
2.6 |
|
Alk Phos |
12.04 |
0.36 |
3.0 |
3.9 |
|
ALT |
27.5 |
0.7 |
3.9 |
>6 |
|
ALT |
27.5 |
0.44 |
2.4 |
>6 |
|
Amylase |
14.6 |
1.0 |
2.0 |
>6 |
|
Amylase |
14.6 |
0.29 |
2.0 |
>6 |
|
AST |
16.7 |
0.0 |
2.3 |
>6 |
|
AST |
16.7 |
0.46 |
1.9 |
>6 |
|
Bilirubin, Direct |
44.50 |
5.7 |
6.1 |
>6 |
|
Bilirubin, Direct |
44.50 |
0.53 |
3.5 |
>6 |
|
Bilirubin, Total |
26.94 |
1.4 |
5.1 |
5.0 |
|
Bilirubin, Total |
26.94 |
2.27 |
1.8 |
>6 |
|
Calcium |
2.55 |
0.3 |
2.8 |
0.8 |
|
Calcium |
2.55 |
0.38 |
1.8 |
1.2 |
|
Chloride |
4.6 |
0.1 |
1.4 |
3.2 |
|
Chloride |
4.6 |
0.08 |
0.7 |
>6 |
|
Cholesterol |
9.01 |
2.3 |
2.5 |
2.7 |
|
Cholesterol |
9.01 |
2.08 |
2.0 |
3.5 |
|
CO2 |
4.86 |
1.4 |
5.4 |
0.6 |
|
CO2 |
4.86 |
2.54 |
5.4 |
0.4 |
|
Creatinine Kinase (CK) |
30.30 |
1.9 |
2.5 |
>6 |
|
Creatinine Kinase (CK) |
30.30 |
2.58 |
1.5 |
>6 |
|
Creatinine |
8.90 |
0.2 |
3.0 |
2.9 |
|
Creatinine |
8.90 |
0.00 |
1.6 |
5.6 |
|
Glucose |
6.96 |
0.0 |
1.7 |
4.1 |
|
Glucose |
6.96 |
0.11 |
1.6 |
4.3 |
|
HDL |
11.63 |
0.4 |
1.8 |
>6 |
|
HDL |
11.63 |
0.02 |
2.4 |
4.8 |
|
Lactate |
30.40 |
0.7 |
1.7 |
>6 |
|
Lactate |
30.40 |
0.71 |
1.9 |
>6 |
|
Lipase |
29.10 |
3.7 |
4.3 |
5.9 |
|
Lipase |
29.10 |
0.71 |
1.9 |
>6 |
|
Magnesium |
4.80 |
0.9 |
3.7 |
1.1 |
|
Magnesium |
4.80 |
1.21 |
2.0 |
1.8 |
|
Phosphorous |
10.70 |
1.5 |
2.8 |
3.3 |
|
Phosphorous |
10.70 |
1.25 |
2.0 |
4.7 |
|
Potassium |
5.6 |
0.0 |
0.9 |
>6 |
|
Potassium |
5.6 |
0.13 |
0.6 |
>6 |
|
Protein, Total |
3.63 |
0.5 |
2.2 |
1.4 |
|
Protein, Total |
3.63 |
1.01 |
2.0 |
1.3 |
|
Sodium |
0.7 |
0.3 |
0.7 |
0.6 |
|
Sodium |
0.7 |
0.19 |
0.5 |
1.0 |
|
Triglycerides |
25.99 |
3.3 |
2.0 |
>6 |
|
Triglycerides |
25.99 |
1.77 |
1.7 |
>6 |
|
Urea Nitrogen |
15.50 |
0.1 |
5.0 |
3.1 |
|
Urea Nitrogen |
15.50 |
2.46 |
3.7 |
3.5 |
|
Uric Acid |
12.00 |
4.3 |
2.0 |
3.9 |
|
Uric Acid |
12.00 |
2.72 |
2.0 |
4.6 |
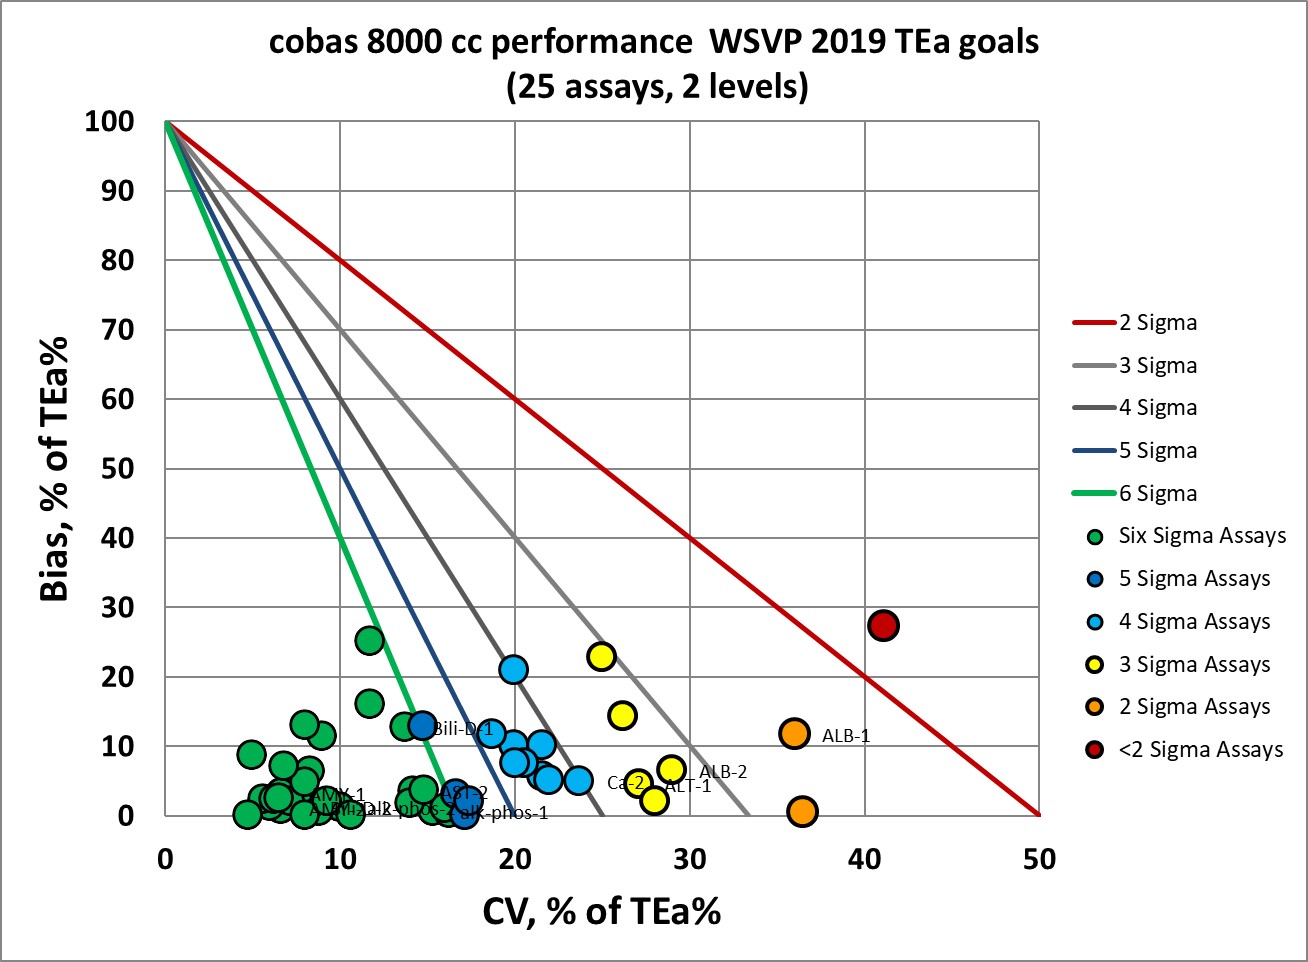
Next, we take the Westgard Sigma VP goals (2019), which is a heterogeneous mixture of CLIA, CAP, RCPA, Ricos 2014, and EuBIVAS goals. The goal of these goals is to find challenging performance specifications, but not impossible ones. Because of this, we've added an additional column to identify the source of each goal.
Sigma-metrics according to Westgard Sigma VP program goams (2019) performance specifications
If you judge with WSVP specifications, there are 64%, nearly two-thirds of the performance, of the assay levels that achieve 5 and 6 Sigma. This approach also minimizes the number of failures, less than 20% of the performance is graded 3 Sigma and lower.
|
TEST |
CLIA 2019 TEa Source |
TEa |
% Bias |
CV |
Sigma |
|
Albumin |
CLIA |
10 |
1.2 |
3.6 |
2.5 |
|
Albumin |
10% |
10 |
0.65 |
2.9 |
3.2 |
|
Alk Phos |
CLIA |
30 |
0.2 |
4.6 |
>6 |
|
Alk Phos |
30% |
30 |
0.36 |
3.0 |
>6 |
|
ALT |
EuBIVAS |
14.4 |
0.7 |
3.9 |
3.5 |
|
ALT |
14% |
14.4 |
0.44 |
2.4 |
5.8 |
|
Amylase |
CLIA |
30.00 |
1.0 |
2.0 |
>6 |
|
Amylase |
30% |
30.00 |
0.29 |
2.0 |
>6 |
|
AST |
EuBIVAS |
13.4 |
0.0 |
2.3 |
5.8 |
|
AST |
13% |
13.4 |
0.46 |
1.9 |
>6 |
|
Bilirubin, Direct |
Ricos |
44.50 |
5.7 |
6.1 |
>6 |
|
Bilirubin, Direct |
44.50% |
44.50 |
0.53 |
3.5 |
>6 |
|
Bilirubin, Total |
CLIA 20% or |
71.17 |
1.4 |
5.1 |
>6 |
|
Bilirubin, Total |
0.4 mg/dL |
20.00 |
2.27 |
1.8 |
>6 |
|
Calcium |
CLIA |
16.10306 |
0.3 |
2.8 |
5.6 |
|
Calcium |
1 mg/dL |
7.593014 |
0.38 |
1.8 |
4.0 |
|
Chloride |
CLIA |
5 |
0.1 |
1.4 |
3.5 |
|
Chloride |
5% |
5 |
0.08 |
0.7 |
>6 |
|
Cholesterol |
CLIA |
10 |
2.3 |
2.5 |
3.1 |
|
Cholesterol |
10% |
10 |
2.08 |
2.0 |
4.0 |
|
CO2 |
CAP (approx) |
25 |
1.4 |
5.4 |
4.4 |
|
CO2 |
25% |
25 |
2.54 |
5.4 |
4.2 |
|
Creatinine Kinase (CK) |
CLIA |
30 |
1.9 |
2.5 |
>6 |
|
Creatinine Kinase (CK) |
30% |
30 |
2.58 |
1.5 |
>6 |
|
Creatinine |
CLIA 15% or |
34.13 |
0.2 |
3.0 |
>6 |
|
Creatinine |
0.3 mg/dL |
15.00 |
0.00 |
1.6 |
>6 |
|
Glucose |
CLIA 10% or |
10.45 |
0.0 |
1.7 |
>6 |
|
Glucose |
6 mg/dL |
10.00 |
0.11 |
1.6 |
>6 |
|
HDL |
CLIA |
30.00 |
0.4 |
1.8 |
>6 |
|
HDL |
30% |
30.00 |
0.02 |
2.4 |
>6 |
|
Lactate |
Ricos |
30.40 |
0.7 |
1.7 |
>6 |
|
Lactate |
30% |
30.40 |
0.71 |
1.9 |
>6 |
|
Lipase |
Ricos |
29.10 |
3.7 |
4.3 |
5.9 |
|
Lipase |
29% |
29.10 |
0.71 |
1.9 |
>6 |
|
Magnesium |
CAP |
25.00 |
0.9 |
3.7 |
>6 |
|
Magnesium |
25% |
25.00 |
1.21 |
2.0 |
>6 |
|
Phosphorous |
CAP 10.7% or |
10.70 |
1.5 |
2.8 |
3.3 |
|
Phosphorous |
0.3 mg/dL |
10.70 |
1.25 |
2.0 |
4.7 |
|
Potassium |
CLIA |
19.01141 |
0.0 |
0.9 |
>6 |
|
Potassium |
0.5 mEq/L |
6.476684 |
0.13 |
0.6 |
>6 |
|
Protein, Total |
CAP |
10.00 |
0.5 |
2.2 |
4.3 |
|
Protein, Total |
10% |
10.00 |
1.01 |
2.0 |
4.5 |
|
Sodium |
CLIA |
3.407155 |
0.3 |
0.7 |
4.5 |
|
Sodium |
4 mEq/L |
2.493766 |
0.19 |
0.5 |
4.6 |
|
Triglycerides |
CLIA |
25.00 |
3.3 |
2.0 |
>6 |
|
Triglycerides |
25% |
25.00 |
1.77 |
1.7 |
>6 |
|
Urea Nitrogen |
CLIA 9% or |
13.70 |
0.1 |
5.0 |
2.7 |
|
Urea Nitrogen |
2.0 mg/dL |
9.00 |
2.46 |
3.7 |
1.8 |
|
Uric Acid |
CLIA |
17.00 |
4.3 |
2.0 |
>6 |
|
Uric Acid |
17% |
17.00 |
2.72 |
2.0 |
>6 |
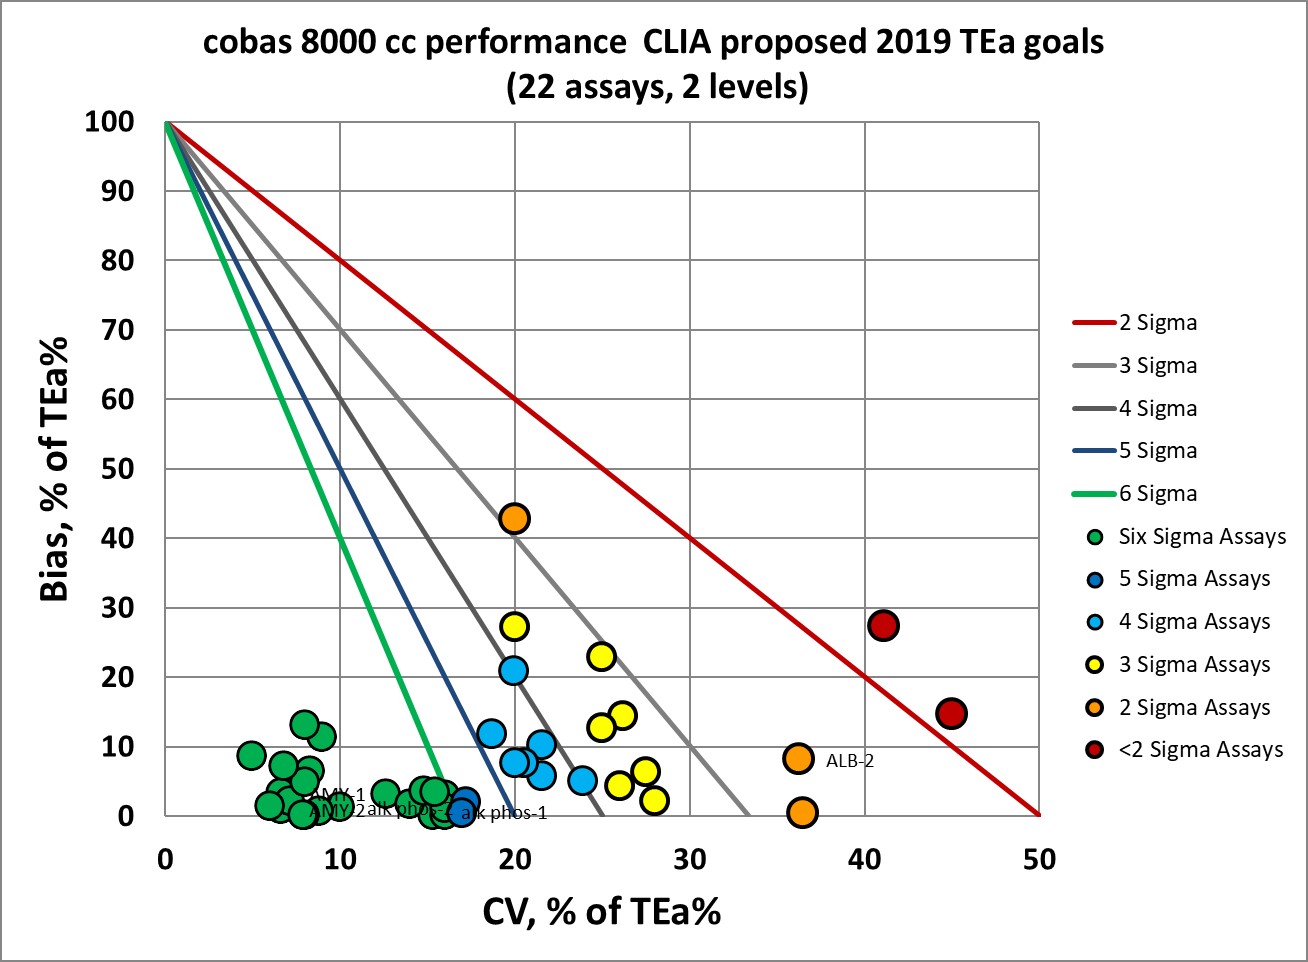
Sigma-metrics according to Proposed CLIA goals of 2019 performance specifications
The proposed updates to the CLIA PT criteria render a verdict of 62% of the assays at 5 and 6 Sigma. They also grade more than a quarter (28%) of the performance at 3 Sigma or lower.
|
TEST |
TEa |
% Bias |
CV % |
Sigma-metric |
|
Albumin |
8 |
1.2 |
3.6 |
1.9 |
|
Albumin |
8 |
0.65 |
2.9 |
2.5 |
|
Alk Phos |
30 |
0.2 |
4.6 |
>6 |
|
Alk Phos |
30 |
0.36 |
3.0 |
>6 |
|
ALT |
15 |
0.7 |
3.9 |
3.7 |
|
ALT |
15 |
0.44 |
2.4 |
>6 |
|
Amylase |
30.00 |
1.0 |
2.0 |
>6 |
|
Amylase |
30.00 |
0.29 |
2.0 |
>6 |
|
AST |
15 |
0.0 |
2.3 |
>6 |
|
AST |
15 |
0.46 |
1.9 |
>6 |
|
Bilirubin, Direct |
44.50 |
5.7 |
6.1 |
>6 |
|
Bilirubin, Direct |
44.50 |
0.53 |
3.5 |
>6 |
|
Bilirubin, Total |
71.17 |
1.4 |
5.1 |
>6 |
|
Bilirubin, Total |
20.00 |
2.27 |
1.8 |
>6 |
|
Calcium |
16.24 |
0.3 |
2.8 |
5.7 |
|
Calcium |
7.52 |
0.38 |
1.8 |
4.0 |
|
Chloride |
5 |
0.1 |
1.4 |
3.5 |
|
Chloride |
5 |
0.08 |
0.7 |
>6 |
|
Cholesterol |
10 |
2.3 |
2.5 |
3.1 |
|
Cholesterol |
10 |
2.08 |
2.0 |
4.0 |
|
CO2 |
25 |
1.4 |
5.4 |
4.4 |
|
CO2 |
25 |
2.54 |
5.4 |
4.2 |
|
Creatinine Kinase (CK) |
30 |
1.9 |
2.5 |
>6 |
|
Creatinine Kinase (CK) |
30 |
2.58 |
1.5 |
>6 |
|
Creatinine |
34.13 |
0.2 |
3.0 |
>6 |
|
Creatinine |
10.00 |
0.00 |
1.6 |
>6 |
|
Glucose |
10.00 |
0.0 |
1.7 |
5.9 |
|
Glucose |
10.00 |
0.11 |
1.6 |
>6 |
|
HDL |
30.00 |
0.4 |
1.8 |
>6 |
|
HDL |
30.00 |
0.02 |
2.4 |
>6 |
|
Lactate |
30.40 |
0.7 |
1.7 |
>6 |
|
Lactate |
30.40 |
0.71 |
1.9 |
>6 |
|
Lipase |
29.10 |
3.7 |
4.3 |
5.9 |
|
Lipase |
29.10 |
0.71 |
1.9 |
>6 |
|
Magnesium |
25.00 |
0.9 |
3.7 |
>6 |
|
Magnesium |
25.00 |
1.21 |
2.0 |
>6 |
|
Phosphorous |
10.70 |
1.5 |
2.8 |
3.3 |
|
Phosphorous |
10.70 |
1.25 |
2.0 |
4.7 |
|
Potassium |
11.40684 |
0.0 |
0.9 |
>6 |
|
Potassium |
3.88601 |
0.13 |
0.6 |
>6 |
|
Protein, Total |
8.00 |
0.5 |
2.2 |
3.4 |
|
Protein, Total |
8.00 |
1.01 |
2.0 |
3.5 |
|
Sodium |
3.407155 |
0.3 |
0.7 |
4.5 |
|
Sodium |
2.493766 |
0.19 |
0.5 |
4.6 |
|
Triglycerides |
25.00 |
3.3 |
2.0 |
>6 |
|
Triglycerides |
25.00 |
1.77 |
1.7 |
>6 |
|
Urea Nitrogen |
13.70 |
0.1 |
5.0 |
2.7 |
|
Urea Nitrogen |
9.00 |
2.46 |
3.7 |
1.8 |
|
Uric Acid |
10.00 |
4.3 |
2.0 |
2.9 |
|
Uric Acid |
10.00 |
2.72 |
2.0 |
3.6 |
Sigma-metrics according to current CLIA performance specifications (established 1992)
Finally, the oldest set of performance specifications grades a little of 60% of the assay performance at 5 and 6 Sigma. Just over 20% of the performance is considered minimally or unacceptable.

|
TEST |
TEa |
% Bias |
CV % |
Sigma-metric |
|
Albumin |
10 |
1.2 |
3.6 |
2.5 |
|
Albumin |
10 |
0.65 |
2.9 |
3.2 |
|
Alk Phos |
30 |
0.2 |
4.6 |
>6 |
|
Alk Phos |
30 |
0.36 |
3.0 |
>6 |
|
ALT |
20 |
0.7 |
3.9 |
5.0 |
|
ALT |
20 |
0.44 |
2.4 |
>6 |
|
Amylase |
30.00 |
1.0 |
2.0 |
>6 |
|
Amylase |
30.00 |
0.29 |
2.0 |
>6 |
|
AST |
20 |
0.0 |
2.3 |
>6 |
|
AST |
20 |
0.46 |
1.9 |
>6 |
|
Bilirubin, Total |
71.17 |
1.4 |
5.1 |
>6 |
|
Bilirubin, Total |
20.00 |
2.27 |
1.8 |
>6 |
|
Calcium |
16.24 |
0.3 |
2.8 |
5.7 |
|
Calcium |
7.52 |
0.38 |
1.8 |
4.0 |
|
Chloride |
5 |
0.1 |
1.4 |
3.5 |
|
Chloride |
5 |
0.08 |
0.7 |
>6 |
|
Cholesterol |
10 |
2.3 |
2.5 |
3.1 |
|
Cholesterol |
10 |
2.08 |
2.0 |
4.0 |
|
CO2 |
25 |
1.4 |
5.4 |
4.4 |
|
CO2 |
25 |
2.54 |
5.4 |
4.2 |
|
Creatinine Kinase (CK) |
30 |
1.9 |
2.5 |
>6 |
|
Creatinine Kinase (CK) |
30 |
2.58 |
1.5 |
>6 |
|
Creatinine |
34.13 |
0.2 |
3.0 |
>6 |
|
Creatinine |
15.00 |
0.00 |
1.6 |
>6 |
|
Glucose |
10.00 |
0.0 |
1.7 |
5.9 |
|
Glucose |
10.00 |
0.11 |
1.6 |
>6 |
|
HDL |
30.00 |
0.4 |
1.8 |
>6 |
|
HDL |
30.00 |
0.02 |
2.4 |
>6 |
|
Magnesium |
25.00 |
0.9 |
3.7 |
>6 |
|
Magnesium |
25.00 |
1.21 |
2.0 |
>6 |
|
Phosphorous |
10.70 |
1.5 |
2.8 |
3.3 |
|
Phosphorous |
10.70 |
1.25 |
2.0 |
4.7 |
|
Potassium |
19.0 |
0.0 |
0.9 |
>6 |
|
Potassium |
6.48 |
0.13 |
0.6 |
>6 |
|
Protein, Total |
10.00 |
0.5 |
2.2 |
4.3 |
|
Protein, Total |
10.00 |
1.01 |
2.0 |
4.5 |
|
Sodium |
3.4 |
0.3 |
0.7 |
4.5 |
|
Sodium |
2.5 |
0.19 |
0.5 |
4.6 |
|
Triglycerides |
25.00 |
3.3 |
2.0 |
>6 |
|
Triglycerides |
25.00 |
1.77 |
1.7 |
>6 |
|
Urea Nitrogen |
13.70 |
0.1 |
5.0 |
2.7 |
|
Urea Nitrogen |
9.00 |
2.46 |
3.7 |
1.8 |
|
Uric Acid |
17.00 |
4.3 |
2.0 |
>6 |
|
Uric Acid |
17.00 |
2.72 |
2.0 |
>6 |
Conclusion
The data here reinforces what we saw in the Atellica analysis: the latest desirable performance specifications derived from EuBIVAS are not practical or achievable in their current form with today's instrumentation. Furthermore, even one of the most advanced chemistry platforms, by any of the approaches used here, has around 1/5th to almost half of the performance considered minimally acceptable or unacceptable. Clearly, even the advanced instruments still have room for improvement. Finally, there is a clear vote against choosing just one set of goals. While CLIA's goals are often considered too wide, even those goals are not uniformly achieved by the cobas 8000. A mixed used of goals, as recommended by the 2015 EFLM Milan Consensus, is the approach that maximizes the successful assessment of instrument performance.