Sigma Metric Analysis
Multimode Sigma metric analysis of a DxC 700
Taking a new study on the DxC 700, we assess what goals can be achieved by one of the leading chemistry platforms.
Sigma metric analysis of a DxC 700 - benchmarking with multiple goals
January 2020
Sten Westgard, MS
Continuing in our series of analyzing major diagnostic instrumentation using the latest sets of performance specifications
(EFLM/EuBIVAS 2020, Ricos 2014, CLIA 2019, and CLIA 1992), we came across a new paper on the Beckman Coutler DxC 700.
Evaluation of the Beckman Coulter DxC 700 AU chemistry platform, Bush VJ, Smola C, Schmitt P, Practical Laboratory Medicince 18 (2020); early online publication.
See the other analyses in this series:
- Beckman Coulter DxC 700
- Abbott Alinity
- Siemens Atellica
- Siemens Atellica in Romania
- Siemens Atellica in Spain
- Siemens ADVIA 2120i
- Roche c501 in Turkey
- Roche c501 in Saudi Arabia
- MicroLab RX-50 in India
- Roche cobas 6000 immunoassays in Turkey
- Sysmex XN 350 in India
- Mindray 7500 in China
- Mindray BS 2000M in China
The raw data of imprecision and bias
We're displaying a select set of the imprecision and bias measured in the study. The published study mentioned the comparison of methods study and the details were not Some assays we excluded because most of the TEa resources did not set TEa performance specifications (for example, hs-CRP, or CSF and Urine analytes). "Precision studies were performed for two levels of quality control for intra-run precision, two levels for most inter-run precision assays with three levels for lipids, bilirubins, and proteins. Quality Control materials (QC) were obtained from Bio-Rad....Intra-run precision was evaluated using 20 replicates of each level of qC for each analyte." This study nearly completed the study at the level of specification of CLSI EP05. "Correlation studies were performed according to CLSI EP09... except samples were analyzed in singlet instead of duplicate. Fresh or frozen/ thawed patient specimens were used for evaluation of the method correlation....Deming regression analysis was performed to calculate the slope, intercept, correlation coefficient (R)...." These biases were determined between the instrument that the laboratory had been previously using (Siemens Dimension Vista for most analytes) and the DxC 700.
Note, however, in the study, the biases used to calculate analytical Sigma-metrics were not the biases calculated from the the Deming regression and comparison study. Instead, those biases were determined from proficiency testing. Those biases were significantly lower.
|
DXC 700 performance data |
||
|
TEST |
% Bias |
CV |
|
Albumin |
12.1 |
3.0 |
|
Albumin |
0.0 |
1.9 |
|
Alk Phos |
26.6 |
5.5 |
|
Alk Phos |
13.1 |
2.1 |
|
ALT |
30.4 |
2.2 |
|
ALT |
20.0 |
1.7 |
|
Amylase |
53.3 |
2.1 |
|
Amylase |
14.5 |
1.0 |
|
AST |
20.2 |
1.5 |
|
AST |
24.9 |
2.6 |
|
Bilirubin, Direct |
16.9 |
3.8 |
|
Bilirubin, Direct |
16.6 |
2.5 |
|
Bilirubin, Total |
0.8 |
1.4 |
|
Bilirubin, Total |
0.3 |
1.8 |
|
C3 |
11.3 |
2.4 |
|
C3 |
8.2 |
1.3 |
|
C3 |
7.1 |
1.0 |
|
C4 |
10.2 |
3.6 |
|
C4 |
25.4 |
2.1 |
|
C4 |
30.0 |
1.7 |
|
Calcium |
4.3 |
0.9 |
|
Calcium |
1.1 |
0.7 |
|
Chloride |
0.7 |
0.6 |
|
Chloride |
0.1 |
0.6 |
|
Cholesterol |
1.7 |
1.1 |
|
Cholesterol |
3.5 |
1.0 |
|
CO2 |
6.5 |
8.6 |
|
CO2 |
1.4 |
7.2 |
|
Creatinine Kinase (CK) |
2.6 |
2.3 |
|
Creatinine Kinase (CK) |
12.5 |
1.2 |
|
Creatinine |
15.0 |
4.1 |
|
Creatinine |
2.9 |
1.7 |
|
Ferritin |
43.6 |
9.8 |
|
Ferritin |
11.0 |
2.3 |
|
Ferritin |
6.8 |
1.4 |
|
GGT |
22.6 |
2.2 |
|
GGT |
26.9 |
0.7 |
|
Glucose |
2.6 |
1.8 |
|
Glucose |
7.8 |
0.8 |
|
HDL |
5.9 |
5.1 |
|
HDL |
3.5 |
3.0 |
|
IgA |
2.8 |
2.5 |
|
IgA |
3.5 |
2.4 |
|
IgA |
5.6 |
1.6 |
|
IgG |
1.9 |
1.4 |
|
IgG |
4.1 |
1.3 |
|
IgG |
5.0 |
2.1 |
|
IgM |
5.8 |
3.5 |
|
IgM |
5.9 |
2.1 |
|
IgM |
5.9 |
1.2 |
|
Iron |
6.4 |
5.5 |
|
Iron |
8.7 |
1.8 |
|
Lactate |
16.6 |
3.5 |
|
Lactate |
9.1 |
2.3 |
|
LDL |
0.7 |
2.9 |
|
LDL |
1.9 |
3.3 |
|
LDH |
17.7 |
3.0 |
|
LDH |
13.0 |
2.1 |
|
Lipase |
113.6 |
6.1 |
|
Lipase |
81.8 |
3.9 |
|
Magnesium |
17.6 |
3.8 |
|
Magnesium |
7.0 |
1.8 |
|
Phosphorous |
7.5 |
2.5 |
|
Phosphorous |
5.9 |
1.2 |
|
Potassium |
0.9 |
0.9 |
|
Potassium |
0.8 |
0.9 |
|
Protein, Total |
1.9 |
1.4 |
|
Protein, Total |
4.1 |
1.4 |
|
Sodium |
1.5 |
0.4 |
|
Sodium |
0.1 |
0.6 |
|
Triglycerides |
3.8 |
2.1 |
|
Triglycerides |
1.3 |
0.9 |
|
Triglycerides |
2.0 |
1.8 |
|
Urea Nitrogen |
0.8 |
1.6 |
|
Urea Nitrogen |
1.7 |
1.7 |
|
Uric Acid |
11.7 |
1.6 |
|
Uric Acid |
6.4 |
1.6 |
Now, the next thing to do is take a look at the latest EFLM performance specifications, as derived from the EuBIVAS biological variation database, which is being updated frequently, so we have 2020 TEa goals for this analysis; Ricos 2014 performance specifications; proposed CLIA 2019 goals; and finally the current 1992 CLIA goals.
Please note that the number of assays will vary from table to table, since not all assays are covered by the latest EuBIVAS database, nor by the CLIA goals. That makes the comparison slightly uneven - but it's a comparison of slightly different sizes of apples, not entirely different fruits.
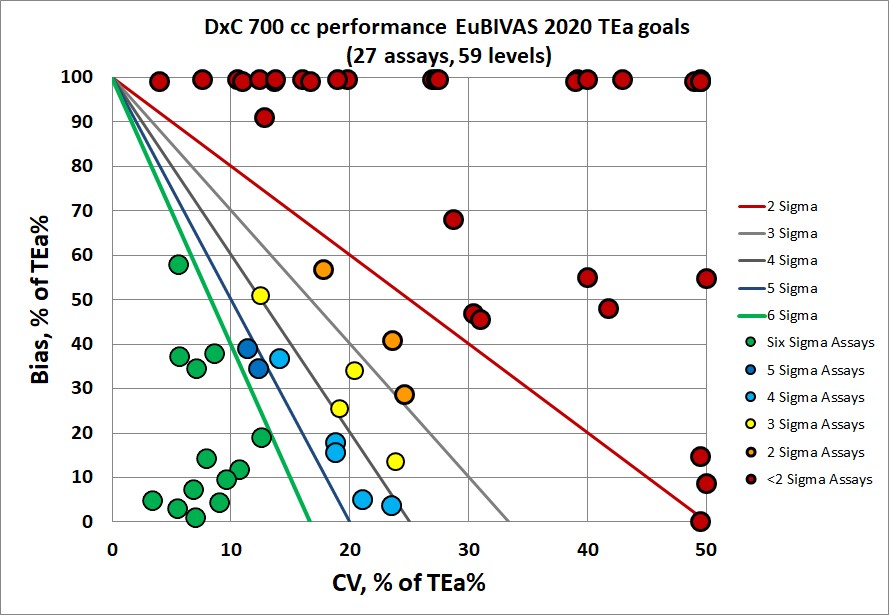
Sigma-metrics according to EuBIVAS-derived desirable performance specifications (as of January 2020)
If you're looking for the toughest set of specifications, this is it. More than half of the assay performance is below 3 Sigma, while just under a quarter of performance is at 6 Sigma. That's the most worst and the least best in our comparison.
|
DXC 700 performance data according to EuBIVAS 2020 goals |
|||||
|
TEST |
TEa Source |
TEa |
% Bias |
CV |
Sigma |
|
Albumin |
EuBIVAS |
3.6 |
12.1 |
3.0 |
negative |
|
Albumin |
3.6% |
3.6 |
0.0 |
1.9 |
1.9 |
|
Alk Phos |
EuBIVAS |
10.6 |
26.6 |
5.5 |
negative |
|
Alk Phos |
10.60% |
10.6 |
13.1 |
2.1 |
negative |
|
ALT |
EuBIVAS |
16.1 |
30.4 |
2.2 |
negative |
|
ALT |
16.1% |
16.1 |
20.0 |
1.7 |
negative |
|
Amylase |
EuBIVAS |
13.1 |
53.3 |
2.1 |
negative |
|
Amylase |
13.1% |
13.1 |
14.5 |
1.0 |
negative |
|
AST |
EuBIVAS |
13.7 |
20.2 |
1.5 |
negative |
|
AST |
13.7% |
13.7 |
24.9 |
2.6 |
negative |
|
Bilirubin, Direct |
EuBIVAS |
44.50 |
16.9 |
3.8 |
7.3 |
|
Bilirubin, Direct |
44.50% |
44.50 |
16.6 |
2.5 |
11.2 |
|
Bilirubin, Total |
EuBIVAS |
25.70 |
0.8 |
1.4 |
17.8 |
|
Bilirubin, Total |
25.70 |
25.70 |
0.3 |
1.8 |
14.1 |
|
C3 |
EuBIVAS |
7.8 |
11.3 |
2.4 |
negative |
|
C3 |
7.8 |
7.8 |
8.2 |
1.3 |
negative |
|
C3 |
7.80% |
7.8 |
7.1 |
1.0 |
0.7 |
|
Calcium |
EuBIVAS |
2.30 |
4.3 |
0.9 |
negative |
|
Calcium |
2.30% |
2.30 |
1.1 |
0.7 |
1.7 |
|
Chloride |
EuBIVAS |
1.2 |
0.7 |
0.6 |
0.9 |
|
Chloride |
1.2% |
1.2 |
0.1 |
0.6 |
1.8 |
|
Cholesterol |
EuBIVAS |
8.80 |
1.7 |
1.1 |
>6 |
|
Cholesterol |
8.80% |
8.80 |
3.5 |
1.0 |
5.3 |
|
Creatinine Kinase (CK) |
EuBIVAS |
21.60 |
2.6 |
2.3 |
>6 |
|
Creatinine Kinase (CK) |
21.60% |
21.60 |
12.5 |
1.2 |
>6 |
|
Creatinine |
EuBIVAS |
7.20 |
15.0 |
4.1 |
negative |
|
Creatinine |
7.2% |
7.20 |
2.9 |
1.7 |
2.5 |
|
GGT |
EuBIVAS |
17.70 |
22.6 |
2.2 |
negative |
|
GGT |
17.7% |
17.70 |
26.9 |
0.7 |
negative |
|
Glucose |
EuBIVAS |
5.80 |
2.6 |
1.8 |
1.8 |
|
Glucose |
5.8% |
5.80 |
7.8 |
0.8 |
negative |
|
HDL |
EuBIVAS |
12.20 |
5.9 |
5.1 |
1.2 |
|
HDL |
12.20% |
12.20 |
3.5 |
3.0 |
2.9 |
|
IgG |
EuBIVAS |
7.30 |
1.9 |
1.4 |
3.9 |
|
IgG |
7.3% |
7.30 |
4.1 |
1.3 |
2.4 |
|
IgG |
7.3% |
7.30 |
5.0 |
2.1 |
1.1 |
|
IgM |
EuBIVAS |
17.10 |
5.8 |
3.5 |
3.2 |
|
IgM |
17.10 |
17.10 |
5.9 |
2.1 |
5.3 |
|
IgM |
17.10 |
17.10 |
5.9 |
1.2 |
>6 |
|
LDL |
EuBIVAS |
13.80 |
0.7 |
2.9 |
4.5 |
|
LDL |
14% |
13.80 |
1.9 |
3.3 |
3.6 |
|
LDH |
EuBIVAS |
7.70 |
17.7 |
3.0 |
negative |
|
LDH |
8% |
7.70 |
13.0 |
2.1 |
negative |
|
Lipase |
EuBIVAS |
14.20 |
113.6 |
6.1 |
negative |
|
Lipase |
14.20 |
14.20 |
81.8 |
3.9 |
negative |
|
Potassium |
EuBIVAS |
4.8 |
0.9 |
0.9 |
4.4 |
|
Potassium |
4.8 |
4.8 |
0.8 |
0.9 |
4.5 |
|
Protein, Total |
EuBIVAS |
3.50 |
1.9 |
1.4 |
1.1 |
|
Protein, Total |
3.5% |
3.50 |
4.1 |
1.4 |
negative |
|
Sodium |
EuBIVAS |
0.7 |
1.5 |
0.4 |
negative |
|
Sodium |
0.7 |
0.7 |
0.1 |
0.6 |
1.0 |
|
Transferrin |
EuBIVAS |
6.40 |
0.2 |
1.5 |
4.1 |
|
Transferrin |
6.40 |
6.40 |
2.4 |
0.9 |
4.5 |
|
Transferrin |
6.40 |
6.40 |
3.3 |
0.8 |
3.9 |
|
Triglycerides |
EuBIVAS |
26.50 |
3.8 |
2.1 |
>6 |
|
Triglycerides |
26.5 |
26.50 |
1.3 |
0.9 |
>6 |
|
Triglycerides |
26.5 |
26.50 |
2.0 |
1.8 |
>6 |
|
Urea Nitrogen |
EuBIVAS |
17.80 |
0.8 |
1.6 |
>6 |
|
Urea Nitrogen |
18% |
17.80 |
1.7 |
1.7 |
>6 |
Negative Sigma, just to be clear, is when the bias is larger than the TEa. So the method is significantly different than the target. In this case, that means the methods on the Dimension Vista and the Beckman Coulter DxC, even when the methodology is similar, are very different.
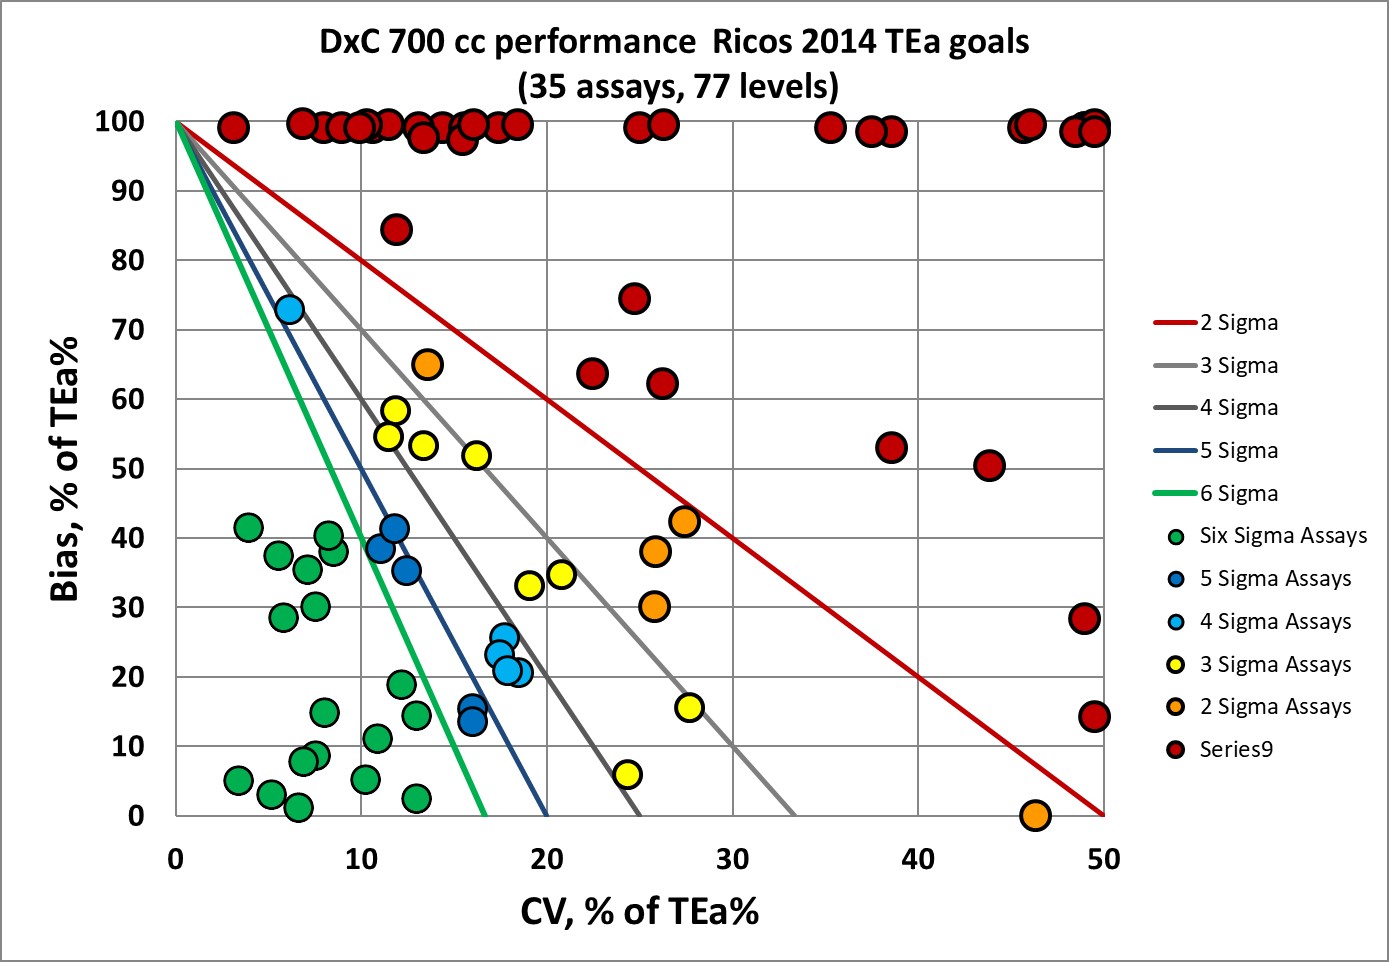
Next, we can look at the "original" version of the biological variation database. The last version of the database was last updated in 2014 by Ricos et al, so we refer to these performance specifications as "Ricos 2014 goals."
Sigma-metrics according to Ricos 2014 desirable performance specifications
The original Ricos goals (desirable performance specifications) are still quite hard on the DxC 700, with a majority of assays below 3 Sigma, and less than a quarter of assay performance at 6 Sigma. Considerably far from desirable.
|
DXC 700 performance data according to Ricos 2014 goals |
|||||
|
TEST |
TEa Source |
TEa |
% Bias |
CV |
Sigma |
|
Albumin |
Ricos 2014 |
4.1 |
12.1 |
3.0 |
negative |
|
Albumin |
4.1% |
4.1 |
0.0 |
1.9 |
2.2 |
|
Alk Phos |
Ricos 2014 |
12.04 |
26.6 |
5.5 |
negative |
|
Alk Phos |
12.04% |
12.04 |
13.1 |
2.1 |
negative |
|
ALT |
Ricos 2014 |
27.5 |
30.4 |
2.2 |
negative |
|
ALT |
27.5% |
27.5 |
20.0 |
1.7 |
4.4 |
|
Amylase |
Ricos 2014 |
14.6 |
53.3 |
2.1 |
negative |
|
Amylase |
14.6% |
14.6 |
14.5 |
1.0 |
0.1 |
|
AST |
Ricos 2014 |
16.7 |
20.2 |
1.5 |
negative |
|
AST |
16.7% |
16.7 |
24.9 |
2.6 |
negative |
|
Bilirubin, Direct |
Ricos 2014 |
44.50 |
16.9 |
3.8 |
>6 |
|
Bilirubin, Direct |
44.50% |
44.50 |
16.6 |
2.5 |
>6 |
|
Bilirubin, Total |
Ricos 2014 |
26.94 |
0.8 |
1.4 |
>6 |
|
Bilirubin, Total |
26.94 |
26.94 |
0.3 |
1.8 |
>6 |
|
C3 |
Ricos |
8.4 |
11.3 |
2.4 |
negative |
|
C3 |
8.4 |
8.4 |
8.2 |
1.3 |
0.2 |
|
C3 |
8.40% |
8.4 |
7.1 |
1.0 |
1.3 |
|
C4 |
Ricos |
16 |
10.2 |
3.6 |
1.6 |
|
C4 |
16.00% |
16 |
25.4 |
2.1 |
negative |
|
C4 |
16 |
16.00 |
30.0 |
1.7 |
negative |
|
Calcium |
Ricos 2014 |
2.55 |
4.3 |
0.9 |
negative |
|
Calcium |
2.55% |
2.55 |
1.1 |
0.7 |
2.1 |
|
Chloride |
Ricos 2014 |
4.6 |
0.7 |
0.6 |
>6 |
|
Chloride |
4.6% |
4.6 |
0.1 |
0.6 |
>6 |
|
Cholesterol |
Ricos 2014 |
9.01 |
1.7 |
1.1 |
>6 |
|
Cholesterol |
9.01% |
9.01 |
3.5 |
1.0 |
5.6 |
|
CO2 |
Ricos 2014 |
4.86 |
6.5 |
8.6 |
negative |
|
CO2 |
4.86% |
4.86 |
1.4 |
7.2 |
0.5 |
|
Creatinine Kinase (CK) |
Ricos 2014 |
30.30 |
2.6 |
2.3 |
>6 |
|
Creatinine Kinase (CK) |
30.30% |
30.30 |
12.5 |
1.2 |
>6 |
|
Creatinine |
Ricos 2014 |
8.90 |
15.0 |
4.1 |
negative |
|
Creatinine |
8.9% |
8.90 |
2.9 |
1.7 |
3.5 |
|
Ferritin |
Ricos 2014 |
16.9 |
43.6 |
9.8 |
-2.7 |
|
Ferritin |
16.9 |
16.9 |
11.0 |
2.3 |
2.6 |
|
Ferritin |
16.9 |
16.9 |
6.8 |
1.4 |
>6 |
|
GGT |
Ricos 2014 |
22.10 |
22.6 |
2.2 |
negative |
|
GGT |
22.1% |
22.10 |
26.9 |
0.7 |
negative |
|
Glucose |
Ricos 2014 |
6.96 |
2.6 |
1.8 |
2.4 |
|
Glucose |
7.0% |
6.96 |
7.8 |
0.8 |
negative |
|
HDL |
Ricos |
11.63 |
5.9 |
5.1 |
1.1 |
|
HDL |
11.63% |
11.63 |
3.5 |
3.0 |
2.7 |
|
IgA |
Ricos |
13.50 |
2.8 |
2.5 |
4.3 |
|
IgA |
13.50% |
13.50 |
3.5 |
2.4 |
4.2 |
|
IgA |
13.50% |
13.50 |
5.6 |
1.6 |
5.0 |
|
IgG |
Ricos 2014 |
8.00 |
1.9 |
1.4 |
4.4 |
|
IgG |
8% |
8.00 |
4.1 |
1.3 |
3.0 |
|
IgG |
8% |
8.00 |
5.0 |
2.1 |
1.4 |
|
IgM |
Ricos 2014 |
16.80 |
5.8 |
3.5 |
3.1 |
|
IgM |
16.80 |
16.80 |
5.9 |
2.1 |
5.2 |
|
IgM |
16.80 |
16.80 |
5.9 |
1.2 |
>6 |
|
Iron |
Ricos 2014 |
30.70 |
6.4 |
5.5 |
4.4 |
|
Iron |
31% |
30.70 |
8.7 |
1.8 |
>6 |
|
Lactate |
Ricos 2014 |
30.40 |
16.6 |
3.5 |
3.9 |
|
Lactate |
30% |
30.40 |
9.1 |
2.3 |
>6 |
|
LDL |
Ricos 2014 |
11.90 |
0.7 |
2.9 |
3.9 |
|
LDL |
12% |
11.90 |
1.9 |
3.3 |
3.0 |
|
LDH |
Ricos 2014 |
11.40 |
17.7 |
3.0 |
negative |
|
LDH |
11% |
11.40 |
13.0 |
2.1 |
negative |
|
Lipase |
Ricos 2014 |
37.88 |
113.6 |
6.1 |
negative |
|
Lipase |
37.88 |
37.88 |
81.8 |
3.9 |
negative |
|
Magnesium |
Ricos 2014 |
4.80 |
17.6 |
3.8 |
negative |
|
Magnesium |
5% |
4.80 |
7.0 |
1.8 |
negative |
|
Phosphorous |
Ricos 2014 |
10.11 |
7.5 |
2.5 |
1.0 |
|
Phosphorous |
10% |
10.11 |
5.9 |
1.2 |
3.5 |
|
Potassium |
Ricos 2014 |
5.61 |
0.9 |
0.9 |
5.3 |
|
Potassium |
5.61 |
5.61 |
0.8 |
0.9 |
5.4 |
|
Protein, Total |
Ricos 2014 |
3.63 |
1.9 |
1.4 |
1.2 |
|
Protein, Total |
4% |
3.63 |
4.1 |
1.4 |
negative |
|
Sodium |
Ricos 2014 |
0.73 |
1.5 |
0.4 |
negative |
|
Sodium |
0.73 |
0.73 |
0.1 |
0.6 |
1.0 |
|
Triglycerides |
Ricos 2014 |
25.99 |
3.8 |
2.1 |
>6 |
|
Triglycerides |
25.99 |
25.99 |
1.3 |
0.9 |
>6 |
|
Triglycerides |
26% |
25.99 |
2.0 |
1.8 |
>6 |
|
Urea Nitrogen |
Ricos 2014 |
15.55 |
0.8 |
1.6 |
>6 |
|
Urea Nitrogen |
16% |
15.55 |
1.7 |
1.7 |
>6 |
|
Uric Acid |
Ricos 2014 |
11.97 |
11.7 |
1.6 |
0.2 |
|
Uric Acid |
12% |
11.97 |
6.4 |
1.6 |
3.5 |
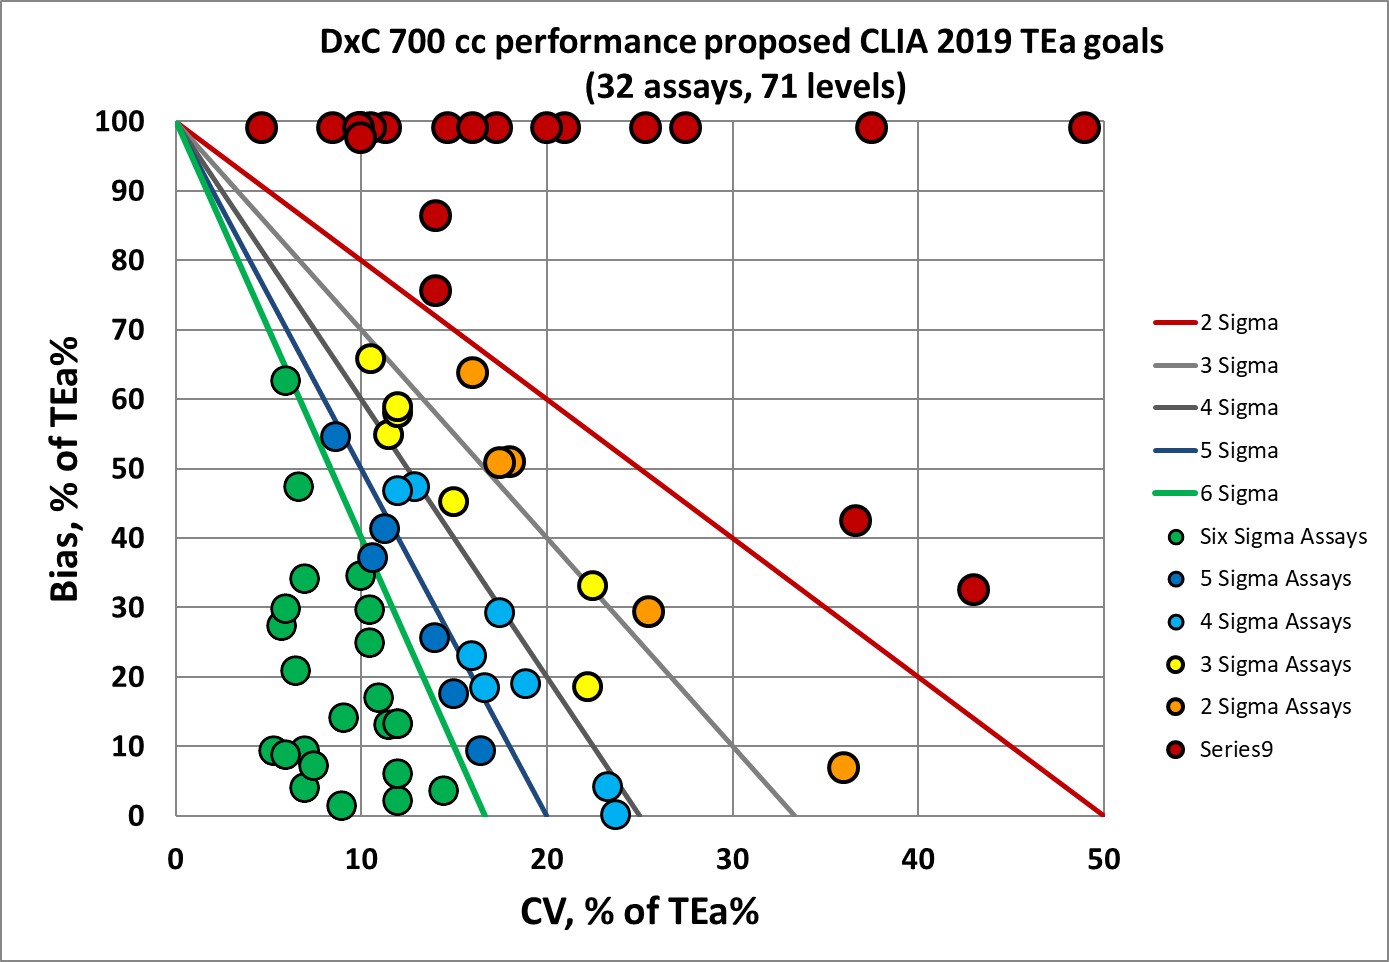
Next we can look at performance specifications which are set by regulatory authorities, not biological variation.
Sigma-metrics according to Proposed CLIA goals of 2019 performance specifications
The 2019 proposals for updated CLIA goals exapnded the number of analytes covered and tightened goals over the original CLIA specifications. almost a third of the assay performance reaches 6 Sigma. Just over a third of the performance is still considered minimally acceptable or unacceptable.
|
DXC 700 performance according to CLIA proposed 2019 goals |
|||||
|
TEST |
TEa Source |
TEa |
% Bias |
CV |
Sigma |
|
Albumin |
CLIA 2019 |
8 |
12.1 |
3.0 |
negative |
|
Albumin |
8% |
8 |
0.0 |
1.9 |
4.2 |
|
Alk Phos |
CLIA 2019 |
20 |
26.6 |
5.5 |
negative |
|
Alk Phos |
20% |
20 |
13.1 |
2.1 |
3.3 |
|
ALT |
CLIA 2019 |
15 |
30.4 |
2.2 |
negative |
|
ALT |
15% |
15 |
20.0 |
1.7 |
negative |
|
Amylase |
CLIA 2019 |
10.00 |
53.3 |
2.1 |
negative |
|
Amylase |
10% |
10.00 |
14.5 |
1.0 |
negative |
|
AST |
CLIA 2019 |
15 |
20.2 |
1.5 |
negative |
|
AST |
15% |
15 |
24.9 |
2.6 |
negative |
|
Bilirubin, Total |
CLIA 2019 |
20.00 |
0.8 |
1.4 |
>6 |
|
Bilirubin, Total |
20 |
20.00 |
0.3 |
1.8 |
>6 |
|
C3 |
CLIA 2019 |
15 |
11.3 |
2.4 |
1.5 |
|
C3 |
15.00% |
15 |
8.2 |
1.3 |
5.3 |
|
C3 |
15.00% |
15 |
7.1 |
1.0 |
>6 |
|
C4 |
CLIA 2019 |
20.00 |
10.2 |
3.6 |
2.7 |
|
C4 |
5 or 20% |
20.00 |
25.4 |
2.1 |
negative |
|
C4 |
16.00% |
20.00 |
30.0 |
1.7 |
negative |
|
Calcium |
CLIA |
15.625 |
4.3 |
0.9 |
>6 |
|
Calcium |
1 mg/dL |
7.692308 |
1.1 |
0.7 |
>6 |
|
Chloride |
CLIA 2019 |
5 |
0.7 |
0.6 |
>6 |
|
Chloride |
5% |
5 |
0.1 |
0.6 |
>6 |
|
Cholesterol |
CLIA |
10 |
1.7 |
1.1 |
>6 |
|
Cholesterol |
10% |
10 |
3.5 |
1.0 |
>6 |
|
CO2 |
CLIA 2019 |
20 |
6.5 |
8.6 |
1.6 |
|
CO2 |
20% |
20 |
1.4 |
7.2 |
2.6 |
|
Creatinine Kinase (CK) |
CLIA 2019 |
20 |
2.6 |
2.3 |
>6 |
|
Creatinine Kinase (CK) |
20% |
20 |
12.5 |
1.2 |
>6 |
|
Creatinine |
CLIA 2019 10% or |
31.78 |
15.0 |
4.1 |
4.1 |
|
Creatinine |
0.3 mg/dL |
31.78 |
2.9 |
1.7 |
>6 |
|
Ferritin |
CLIA 2019 |
20 |
43.6 |
9.8 |
negative |
|
Ferritin |
20 |
20 |
11.0 |
2.3 |
3.9 |
|
Ferritin |
20 |
20 |
6.8 |
1.4 |
>6 |
|
GGT |
CLIA 2019 |
22.32 |
22.6 |
2.2 |
negative |
|
GGT |
5 or 15% |
15.00 |
26.9 |
0.7 |
negative |
|
Glucose |
CLIA 2019 |
8.00 |
2.6 |
1.8 |
3.0 |
|
Glucose |
8% |
8.00 |
7.8 |
0.8 |
0.2 |
|
HDL |
CLIA 2019 |
20.00 |
5.9 |
5.1 |
2.8 |
|
HDL |
20% |
20.00 |
3.5 |
3.0 |
5.5 |
|
IgA |
CLIA 2019 |
15.00 |
2.8 |
2.5 |
4.9 |
|
IgA |
15.00% |
15.00 |
3.5 |
2.4 |
4.8 |
|
IgA |
15.00% |
15.00 |
5.6 |
1.6 |
5.9 |
|
IgG |
CLIA 2019 |
20.00 |
1.9 |
1.4 |
>6 |
|
IgG |
20% |
20.00 |
4.1 |
1.3 |
>6 |
|
IgG |
20% |
20.00 |
5.0 |
2.1 |
>6 |
|
IgM |
CLIA 2019 |
20.00 |
5.8 |
3.5 |
4.1 |
|
IgM |
20% |
20.00 |
5.9 |
2.1 |
>6 |
|
IgM |
20% |
20.00 |
5.9 |
1.2 |
>6 |
|
Iron |
CLIA 2019 |
15.00 |
6.4 |
5.5 |
1.6 |
|
Iron |
15% |
15.00 |
8.7 |
1.8 |
3.5 |
|
LDL |
CLIA 2019 |
20.00 |
0.7 |
2.9 |
>6 |
|
LDL |
20% |
20.00 |
1.9 |
3.3 |
5.5 |
|
LDH |
CLIA 2019 |
15.00 |
17.7 |
3.0 |
negative |
|
LDH |
15% |
15.00 |
13.0 |
2.1 |
1.0 |
|
Magnesium |
CLIA 2019 |
15.00 |
17.6 |
3.8 |
negative |
|
Magnesium |
15% |
15.00 |
7.0 |
1.8 |
4.4 |
|
Phosphorous |
CLIA 2019 |
16.67 |
7.5 |
2.5 |
3.7 |
|
Phosphorous |
0.3 or 10% |
10.00 |
5.9 |
1.2 |
3.4 |
|
Potassium |
CLIA |
12 |
0.9 |
0.9 |
>6 |
|
Potassium |
0.3 mEq/L |
4.054054 |
0.8 |
0.9 |
3.7 |
|
Protein, Total |
CLIA 2019 |
8.00 |
1.9 |
1.4 |
4.3 |
|
Protein, Total |
8% |
8.00 |
4.1 |
1.4 |
2.8 |
|
Sodium |
CLIA 2019 |
3.542958 |
1.5 |
0.4 |
5.2 |
|
Sodium |
4 mEq/L |
2.574003 |
0.1 |
0.6 |
4.1 |
|
Triglycerides |
CLIA 2019 |
15.00 |
3.8 |
2.1 |
5.3 |
|
Triglycerides |
15 |
15.00 |
1.3 |
0.9 |
>6 |
|
Triglycerides |
15% |
15.00 |
2.0 |
1.8 |
>6 |
|
Urea Nitrogen |
CLIA 2019 9% or |
13.33 |
0.8 |
1.6 |
>6 |
|
Urea Nitrogen |
2.0 mg/dL |
9.00 |
1.7 |
1.7 |
4.3 |
|
Uric Acid |
CLIA 2019 |
10.00 |
11.7 |
1.6 |
negative |
|
Uric Acid |
10% |
10.00 |
6.4 |
1.6 |
2.3 |
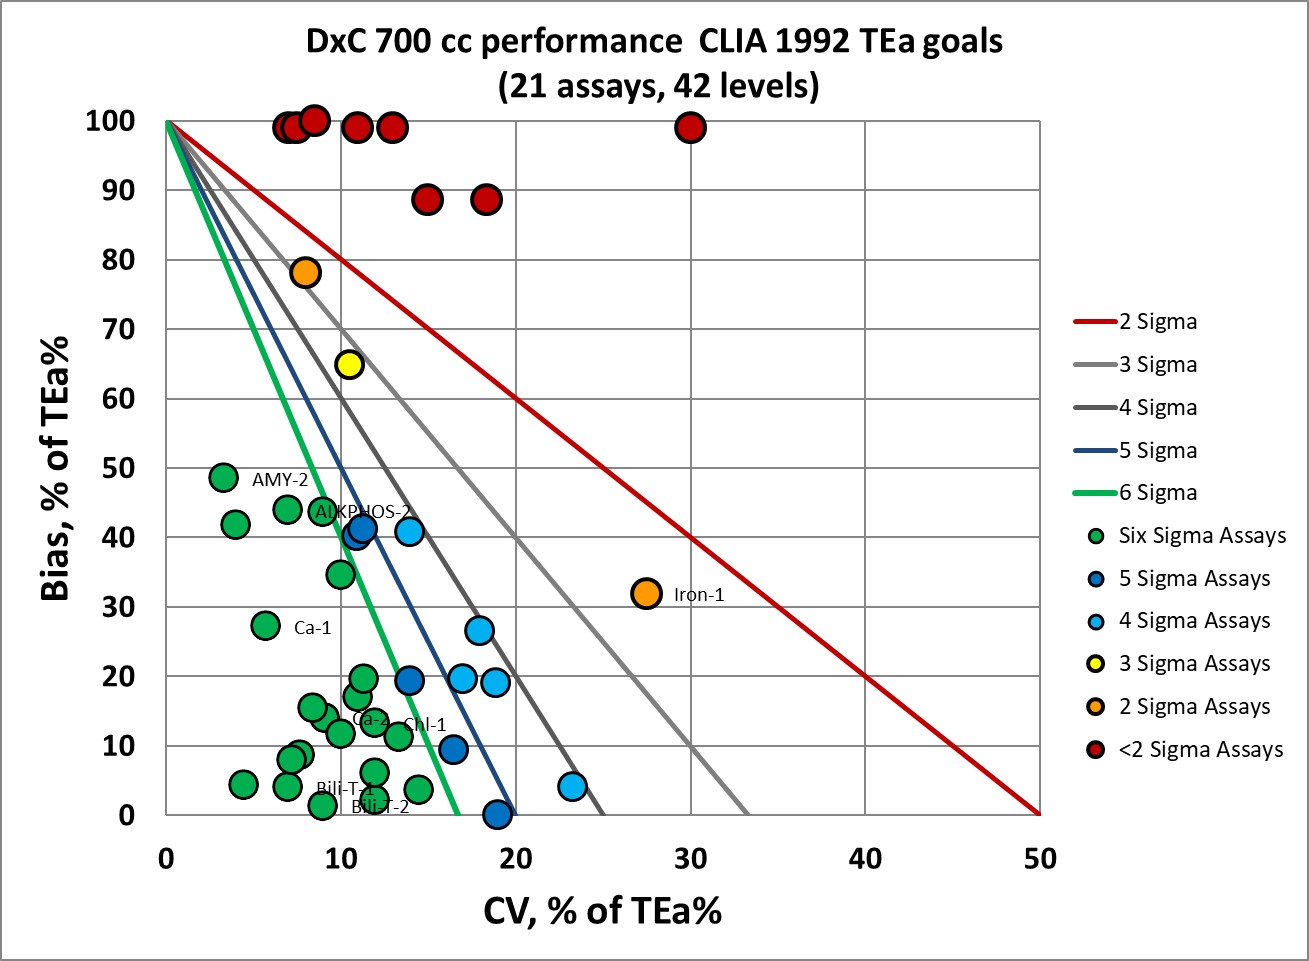
Sigma-metrics according to current CLIA performance specifications (established 1992)
Finally, the oldest set of performance specifications grades more than half of assay performance at 6 Sigma. This also benchmarks less than 25% of the assays as minimally acceptable or unacceptable.
|
DXC 700 performance data CLIA original 1992 goals |
|||||
|
TEST |
TEa Source |
TEa |
% Bias |
CV |
Sigma |
|
Albumin |
CLIA |
10 |
12.1 |
3.0 |
negative |
|
Albumin |
10% |
10 |
0.0 |
1.9 |
5.3 |
|
Alk Phos |
CLIA |
30 |
26.6 |
5.5 |
0.6 |
|
Alk Phos |
30% |
30 |
13.1 |
2.1 |
>6 |
|
ALT |
CLIA |
20 |
30.4 |
2.2 |
negative |
|
ALT |
20% |
20 |
20.0 |
1.7 |
0.0 |
|
Amylase |
CLIA |
30.00 |
53.3 |
2.1 |
negative |
|
Amylase |
30% |
30.00 |
14.5 |
1.0 |
>6 |
|
AST |
CLIA |
20 |
20.2 |
1.5 |
negative |
|
AST |
20% |
20 |
24.9 |
2.6 |
negative |
|
Bilirubin, Total |
CLIA 20% or |
20.00 |
0.8 |
1.4 |
>6 |
|
Bilirubin, Total |
0.4 mg/dL |
20.00 |
0.3 |
1.8 |
>6 |
|
Calcium |
CLIA |
15.625 |
4.3 |
0.9 |
>6 |
|
Calcium |
1 mg/dL |
7.692308 |
1.1 |
0.7 |
>6 |
|
Chloride |
CLIA |
5 |
0.7 |
0.6 |
>6 |
|
Chloride |
5% |
5 |
0.1 |
0.6 |
>6 |
|
Cholesterol |
CLIA |
10 |
1.7 |
1.1 |
>6 |
|
Cholesterol |
10% |
10 |
3.5 |
1.0 |
>6 |
|
Creatinine Kinase (CK) |
CLIA |
30 |
2.6 |
2.3 |
>6 |
|
Creatinine Kinase (CK) |
30% |
30 |
12.5 |
1.2 |
>6 |
|
Creatinine |
CLIA 15% or |
37.50 |
15.0 |
4.1 |
5.5 |
|
Creatinine |
0.3 mg/dL |
15.00 |
2.9 |
1.7 |
>6 |
|
Glucose |
CLIA 10% or |
10.00 |
2.6 |
1.8 |
4.1 |
|
Glucose |
6 mg/dL |
10.00 |
7.8 |
0.8 |
2.7 |
|
HDL |
CLIA |
30.00 |
5.9 |
5.1 |
4.7 |
|
HDL |
30% |
30.00 |
3.5 |
3.0 |
>6 |
|
Iron |
CLIA |
20.00 |
6.4 |
5.5 |
2.5 |
|
Iron |
20% |
20.00 |
8.7 |
1.8 |
>6 |
|
LDL |
CLIA |
20.00 |
0.7 |
2.9 |
>6 |
|
LDL |
20% |
20.00 |
1.9 |
3.3 |
5.5 |
|
LDH |
CAP |
20.00 |
17.7 |
3.0 |
0.8 |
|
LDH |
20% |
20.00 |
13.0 |
2.1 |
3.4 |
|
Potassium |
CLIA |
20 |
0.9 |
0.9 |
>6 |
|
Potassium |
0.5 mEq/L |
6.756757 |
0.8 |
0.9 |
>6 |
|
Protein, Total |
CLIA |
10.00 |
1.9 |
1.4 |
5.8 |
|
Protein, Total |
10% |
10.00 |
4.1 |
1.4 |
4.2 |
|
Sodium |
CLIA |
3.542958 |
1.5 |
0.4 |
5.2 |
|
Sodium |
4 mEq/L |
2.574003 |
0.1 |
0.6 |
4.1 |
|
Triglycerides |
CLIA |
25.00 |
3.8 |
2.1 |
>6 |
|
Triglycerides |
CLIA |
25.00 |
1.3 |
0.9 |
>6 |
|
Triglycerides |
25% |
25.00 |
2.0 |
1.8 |
>6 |
|
Urea Nitrogen |
CLIA 9% or |
13.33 |
0.8 |
1.6 |
>6 |
|
Urea Nitrogen |
2.0 mg/dL |
9.00 |
1.7 |
1.7 |
4.3 |
Conclusion
The data here reinforces what we saw in other analyses in this series: the latest desirable performance specifications derived from EuBIVAS are not practical or achievable in their current form with today's instrumentation. Furthermore, even one of the most advanced chemistry platforms, by any of the approaches used here, has around 1/4 to more than half of the performance considered as minimally acceptable or unacceptable. Clearly, even the advanced instruments still have room for improvement. Finally, there is a clear vote against choosing just one set of goals. While CLIA's goals are often considered too wide, even those goals are not uniformly achieved by the DxC 700. A mixed used of goals, as recommended by the 2015 EFLM Milan Consensus, is the approach that maximizes the successful assessment of instrument performance.
The other factor is the difference between the Dimension Vista and the DxC 700. Much of the poor Sigma metric performance can be attributed to large analytical biases (or differences) between these two instruments. Considering these are major instruments and are in an area (biochemistry) where standardization is supposed to be strong and many labs often assume that quality is a commodity. There are significant discrepancies between the instruments. It's not possible to know which instrument is "right" and which is "wrong" but this does underscore the need for labs to always assure quality, not assume quality.