Sigma Metric Analysis
Multimode Sigma metric analysis of an Abbott Alinity
Continuing in our series of Sigma analysis of the leading diagnostic platforms, we turn our attention to the Abbott Alinity, and assess what goals can be achieved by this chemistry instrument.
Sigma metric analysis of an Abbott Alinity - benchmarking with multiple goals
February 2020
Sten Westgard, MS
See the other analyses in this series:
- Beckman Coulter DxC 700
- Abbott Alinity
- Siemens Atellica
- Siemens Atellica in Romania
- Siemens Atellica in Spain
- Siemens ADVIA 2120i
- Roche c501 in Turkey
- Roche c501 in Saudi Arabia
- MicroLab RX-50 in India
- Roche cobas 6000 immunoassays in Turkey
- Sysmex XN 350 in India
- Mindray 7500 in China
- Mindray BS 2000M in China
Continuing in our series of analyzing major diagnostic instrumentation using the latest sets of performance specifications
(EFLM/EuBIVAS 2020, Ricos 2014, CLIA 2019, and CLIA 1992), we are taking a look at one of the first papers on the Abbott Alinity .
Assessing precision, bias and sigma-metrics of 53 measurands of the Alinity ci system. Westgard S, Petrides V, Schneider S, Berman M, Herzogenrath J, Orzechowski A. .Clin Biochem. 2017 Dec;50(18):1216-1221. doi: 10.1016/j.clinbiochem.2017.09.005. Epub 2017 Sep 14.
One thing the reader may quickly note, I am one of the primary authors of this paper. Therefore, I should note some disclosures necessary to make when discussing this paper. Of specific relevance here: Westgard QC, Inc. has a contract with Abbott Diagnostics covering education, training, and consulting services. For the writing and editing of this specific paper, however, no funds were involved.
The raw data of imprecision and bias
We will display the set of chemistry assay imprecision and bias published in this study. The paper noted performance at a single critical decision level, so there is only one Sigma metric per assay, rather than Sigma metrics measured at all control levels. This makes the comparison with the other platforms a little less like an "apples-to-apples" comparison.
"The imprecision for each assay was estimated via a precision study conducted at Abbott using the Alinity ci system following the guidelines of CLSI EP05-A2 [14].... Each control and panel was tested in replicates of 2–3 during 2 runs each day for at least 20 days, and an analysis of variance (ANOVA) of the data was performed to estimate the variance components [standard deviation (SD) and percent coefficient of variation (%CV)] for repeatability, between-run and a within-laboratory precision of the assay. For each assay, the precision study was conducted using a minimum of one Alinity system and one reagent lot. The within-laboratory %CV at or near the medical decision level was used in the Sigma-metric calculation...."
"Bias was estimated, following the principles of the CLSI EP09-A3 guideline, by testing between 100 and 200 samples, over at least three days, with testing in duplicate at Abbott on the Alinity c and ARCHITECT c8000 systems for clinical chemistry and
ICT assays and on the Alinity i and ARCHITECT i2000SR systems for the immunoassays. The ARCHITECT c8000 and i2000SR systems were chosen as the comparator methods because they were the measuring systems upon which the assays were originally developed. Each assay was tested using at least one Alinity and one ARCHITECT system. Using Passing-Bablok or weighted Deming regression methods, the first replicate of the Alinity concentration was compared against the mean of
the ARCHITECT results; these more sophisticated regression techniques help to identify the real bias versus the comparator to identify and minimize the effect of imprecision present during the comparison study. Using these regression models, the %bias was estimated near a medical decision point...."
Alinity performance observed |
||
|
TEST |
% Bias |
CV% |
|
Albumin BCG |
0.0 |
0.9 |
|
Albumin BCP |
0.0 |
1.1 |
|
Alk Phos |
3.4 |
1.6 |
|
Activated ALT |
0.8 |
0.9 |
|
ALT |
0.3 |
2.8 |
|
Activated AST |
3.0 |
2.2 |
|
AST |
3.4 |
1.5 |
|
Amylase |
0.0 |
0.8 |
|
Bilirubin, Direct |
1.0 |
3.9 |
|
Bilirubin, Total |
1.8 |
2.0 |
|
C-Reactive Protein |
1.9 |
3.1 |
|
Calcium |
1.4 |
1.0 |
|
Chloride |
0.1 |
0.8 |
|
Cholesterol |
1.3 |
1.0 |
|
CO2 |
3.1 |
3.9 |
|
Creatinine Kinase (CK) |
1.8 |
1.1 |
|
Creatinine |
1.9 |
1.9 |
|
Creatinine - enzymatic |
0.9 |
1.0 |
|
GGT |
2.8 |
1.2 |
|
Glucose |
0.2 |
1.1 |
|
HDL |
0.9 |
2.1 |
|
Iron |
3.1 |
1.2 |
|
Lactate |
1.6 |
2.1 |
|
LDL |
1.2 |
1.6 |
|
LDH |
1.4 |
3.4 |
|
Magnesium |
0.0 |
1.4 |
|
Phosphorous |
0.1 |
1.8 |
|
Potassium |
0.6 |
1.5 |
|
Protein, Total |
0.6 |
1.2 |
|
Sodium |
0.1 |
0.8 |
|
Transferrin |
1.9 |
1.3 |
|
Triglycerides |
1.1 |
0.9 |
|
Urea Nitrogen |
1.2 |
1.8 |
|
Uric Acid |
1.2 |
1.0 |
Now, the next thing to do is take a look at the latest EFLM performance specifications, as derived from the EuBIVAS biological variation database, which is being updated frequently, so we have 2020 TEa goals for this analysis. We also used the Ricos 2014 performance specifications; proposed CLIA 2019 goals; and finally the current 1992 CLIA goals.
Please note that the number of assays will vary from table to table, since not all assays are covered by the latest EuBIVAS database, nor by the CLIA goals. That makes the comparison slightly uneven - but it's a comparison of slightly different sizes of apples, not entirely different fruits.
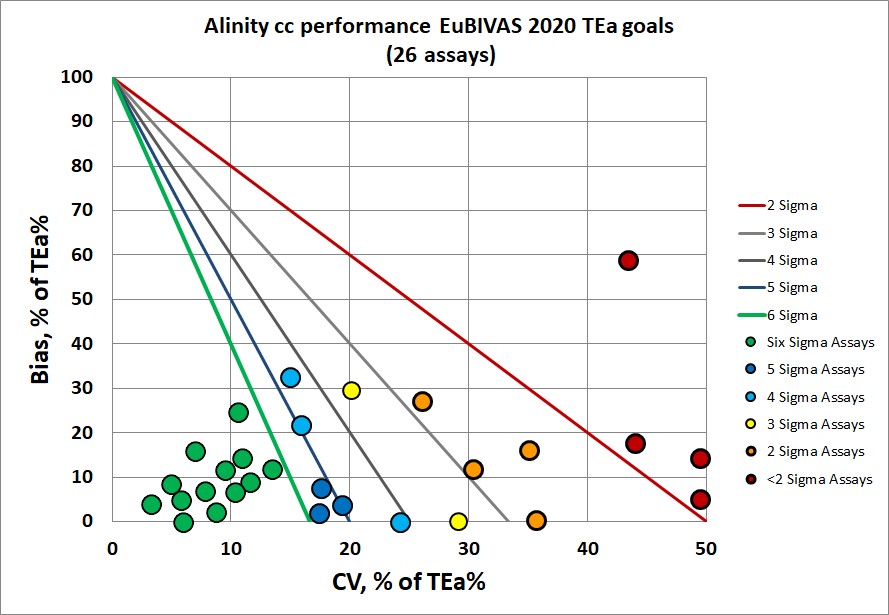
Sigma-metrics according to EuBIVAS-derived desirable performance specifications (as of January 2020)
If you're looking for the toughest set of specifications, this is it. More than half of the assay performance is below 3 Sigma, while just under a quarter of performance is at 6 Sigma. That's the most worst and the least best in our comparison.
|
Abbott Alinity performance, according to desirable TEa goals |
||||
|
TEST |
TEa |
% Bias |
CV |
Sigma |
|
Albumin BCG |
3.8 |
0.0 |
0.9 |
4.1 |
|
Albumin BCP |
3.8 |
0.0 |
1.1 |
3.4 |
|
Alk Phos |
10.6 |
3.4 |
1.6 |
4.5 |
|
Activated ALT |
16.1 |
0.8 |
0.9 |
>6 |
|
ALT |
16.1 |
0.3 |
2.8 |
5.6 |
|
Activated AST |
13.7 |
3.0 |
2.2 |
4.9 |
|
AST |
13.7 |
3.4 |
1.5 |
>6 |
|
Amylase |
13.1 |
0.0 |
0.8 |
>6 |
|
Bilirubin, Direct |
44.50 |
1.0 |
3.9 |
>6 |
|
Bilirubin, Total |
25.70 |
1.8 |
2.0 |
>6 |
|
Calcium |
2.30 |
1.4 |
1.0 |
<3 |
|
Chloride |
1.2 |
0.1 |
0.8 |
<3 |
|
Cholesterol |
8.80 |
1.3 |
1.0 |
>6 |
|
Creatinine Kinase (CK) |
21.60 |
1.8 |
1.1 |
>6 |
|
Creatinine |
7.20 |
1.9 |
1.9 |
<3 |
|
Creatinine - enzymatic |
7.20 |
0.9 |
1.0 |
>6 |
|
GGT |
17.70 |
2.8 |
1.2 |
>6 |
|
Glucose |
5.80 |
0.2 |
1.1 |
5.0 |
|
HDL |
12.20 |
0.9 |
2.1 |
5.3 |
|
LDL |
13.80 |
1.2 |
1.6 |
>6 |
|
LDH |
7.70 |
1.4 |
3.4 |
<3 |
|
Magnesium |
4.00 |
0.0 |
1.4 |
<3 |
|
Potassium |
4 |
0.6 |
1.5 |
<3 |
|
Protein, Total |
3.50 |
0.6 |
1.2 |
<3 |
|
Sodium |
0.7 |
0.1 |
0.8 |
<3 |
|
Transferrin |
6.4 |
1.9 |
1.3 |
3.5 |
|
Triglycerides |
26.50 |
1.1 |
0.9 |
>6 |
|
Urea Nitrogen |
17.80 |
1.2 |
1.8 |
>6 |
|
Uric Acid |
10.60 |
1.2 |
1.0 |
>6 |
We simplify the assessment here to state "above 6 Sigma" and "below 3 Sigma" because in the extreme cases, there is no practical difference to how a laboratory runs QC for a 6 Sigma assay vs. a 12 Sigma assay.
Perhaps uniquely among the instruments on the market, the Alinity has a majority of assays that can achieve 6 Sigma even when the most stringent performance specifications are applied. There are still a few assays that have unacceptable performance when judged by EuBIVAS standards, but these are assays (Calcium, Chloride, Sodium, Creatinine) where the goals being suggested are next to impossible for today's technology. For those assays, with those goals, there are currently no instruments on the market that are really capable of consistently achieving high sigma performance
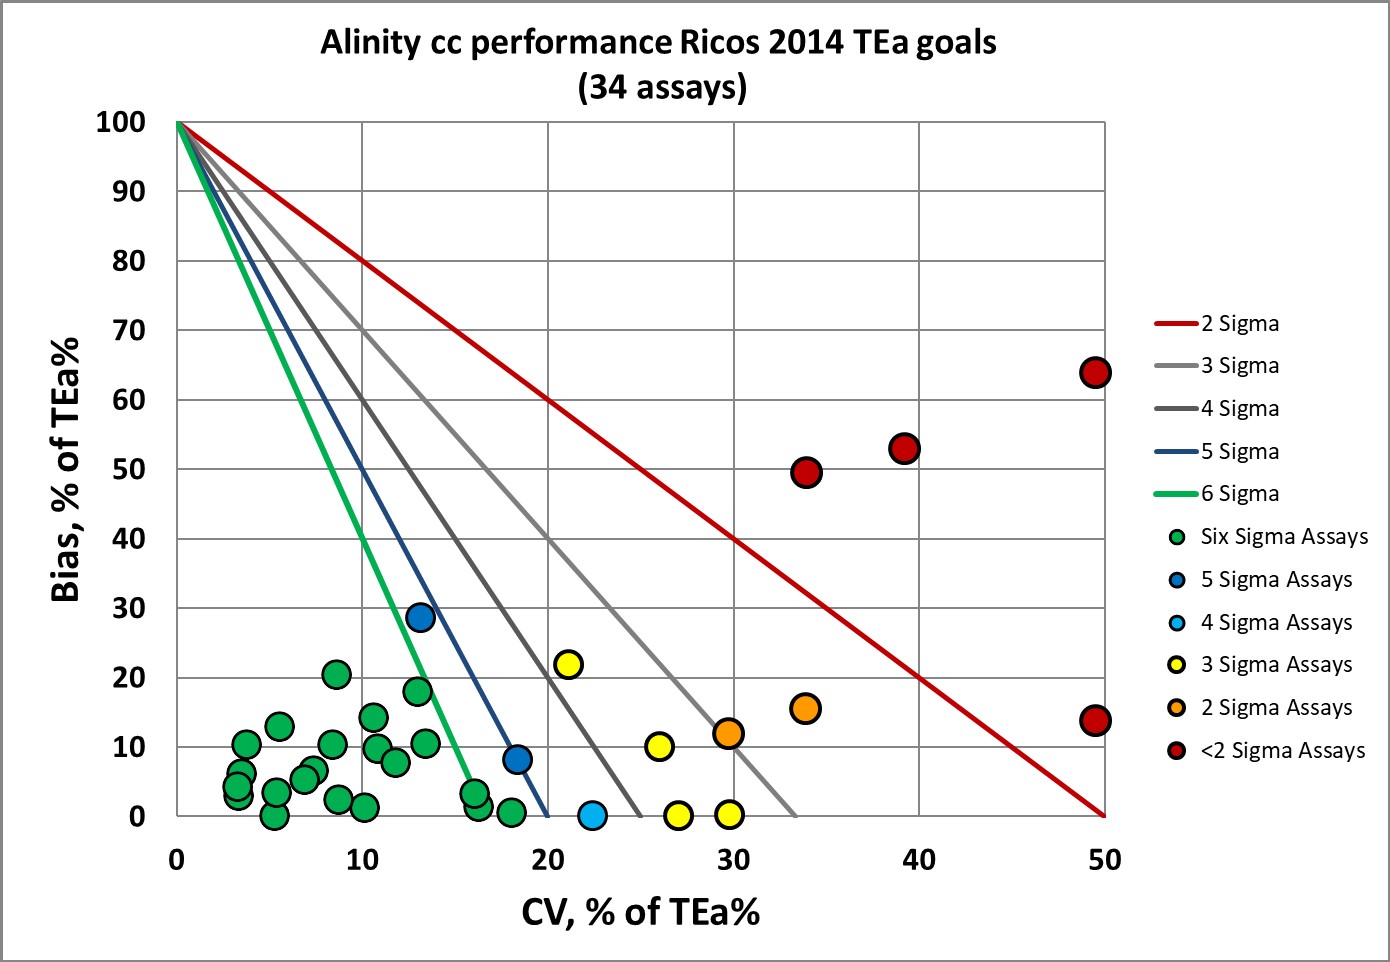
Next, we can look at the "original" version of the biological variation database. The last version of the database was last updated in 2014 by Ricos et al, so we refer to these performance specifications as "Ricos 2014 goals."
Sigma-metrics according to Ricos 2014 desirable performance specifications
The original Ricos goals (desirable performance specifications) are still challenging, but nearly 60% of the assays on the Alinity are still at 6 Sigma. 6 of the assays are below 3 Sigma. This particular data set is the largest that can be benchmarked, since the 2014 Ricos database is still the largest set of performance specifications available.
|
Abbott Alinity performance, according to desirable TEa goals |
||||
|
TEST |
TEa |
% Bias |
CV |
Sigma |
|
Albumin BCG |
4.1 |
0.0 |
0.9 |
4.5 |
|
Albumin BCP |
4.1 |
0.0 |
1.1 |
3.7 |
|
Alk Phos |
12.04 |
3.4 |
1.6 |
5.4 |
|
Activated ALT |
27.5 |
0.8 |
0.9 |
>6 |
|
ALT |
27.5 |
0.3 |
2.8 |
>6 |
|
Activated AST |
16.7 |
3.0 |
2.2 |
>6 |
|
AST |
16.7 |
3.4 |
1.5 |
>6 |
|
Amylase |
14.6 |
0.0 |
0.8 |
>6 |
|
Bilirubin, Direct |
44.50 |
1.0 |
3.9 |
>6 |
|
Bilirubin, Total |
26.94 |
1.8 |
2.0 |
>6 |
|
C-Reactive Protein |
56.60 |
1.9 |
3.1 |
>6 |
|
Calcium |
2.55 |
1.4 |
1.0 |
<3 |
|
Chloride |
4.6 |
0.1 |
0.8 |
>6 |
|
Cholesterol |
9.01 |
1.3 |
1.0 |
>6 |
|
CO2 |
4.86 |
3.1 |
3.9 |
<3 |
|
Creatinine Kinase (CK) |
30.30 |
1.8 |
1.1 |
>6 |
|
Creatinine |
8.90 |
1.9 |
1.9 |
3.7 |
|
Creatinine - enzymatic |
8.90 |
0.9 |
1.0 |
>6 |
|
GGT |
22.10 |
2.8 |
1.2 |
>6 |
|
Glucose |
6.96 |
0.2 |
1.1 |
6.0 |
|
HDL |
11.63 |
0.9 |
2.1 |
5.0 |
|
Iron |
30.70 |
3.1 |
1.2 |
>6 |
|
Lactate |
30.40 |
1.6 |
2.1 |
>6 |
|
LDL |
11.90 |
1.2 |
1.6 |
>6 |
|
LDH |
11.40 |
1.4 |
3.4 |
3.0 |
|
Magnesium |
4.80 |
0.0 |
1.4 |
3.3 |
|
Phosphorous |
10.11 |
0.1 |
1.8 |
5.5 |
|
Potassium |
5.61 |
0.6 |
1.5 |
3.5 |
|
Protein, Total |
3.63 |
0.6 |
1.2 |
<3 |
|
Sodium |
0.73 |
0.1 |
0.8 |
<3 |
|
Transferrin |
3.80 |
1.9 |
1.3 |
<3 |
|
Triglycerides |
25.99 |
1.1 |
0.9 |
>6 |
|
Urea Nitrogen |
15.55 |
1.2 |
1.8 |
>6 |
|
Uric Acid |
11.97 |
1.2 |
1.0 |
>6 |
Next we can look at performance specifications which are set by regulatory authorities, not biological variation.
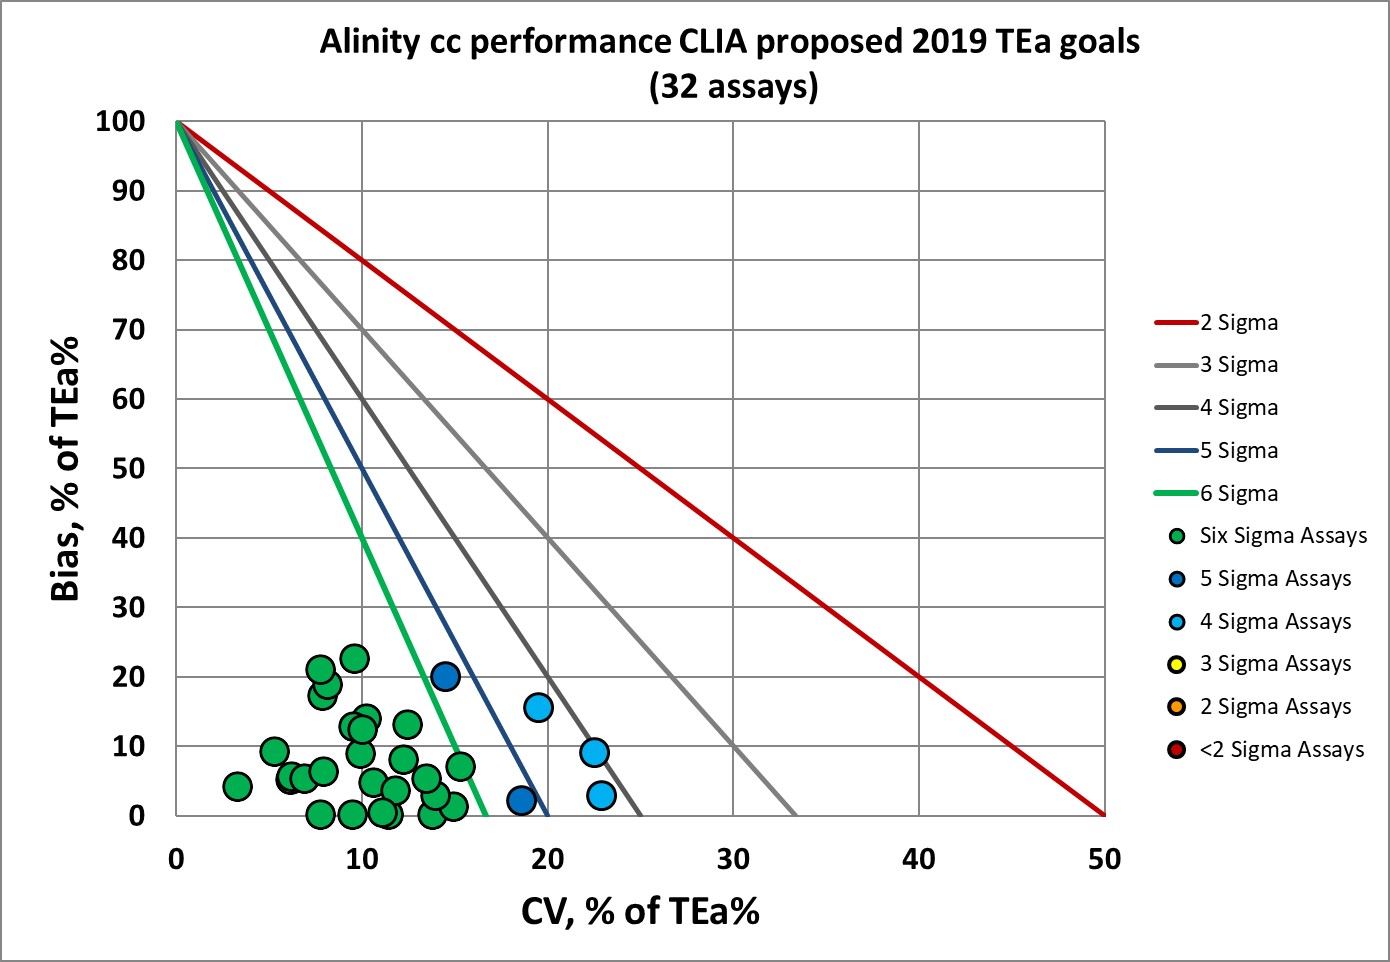
Sigma-metrics according to Proposed CLIA goals of 2019 performance specifications
The 2019 proposals for updated CLIA goals expanded the number of analytes covered and tightened goals over the original CLIA specifications. With these goals, Alinity reaches a point where no assays are considered unacceptable.
| Abbott Alinity performance, according to TEa goals proposed for updated CLIA (32 methods) |
||||
|
TEST |
TEa |
% Bias |
CV |
Sigma |
|
Albumin BCG |
8 |
0.0 |
0.9 |
>6 |
|
Albumin BCP |
8 |
0.0 |
1.1 |
>6 |
|
Alk Phos |
20 |
3.4 |
1.6 |
>6 |
|
Activated ALT |
15 |
0.8 |
0.9 |
>6 |
|
ALT |
15 |
0.3 |
2.8 |
5.3 |
|
Activated AST |
15 |
3.0 |
2.2 |
5.5 |
|
AST |
15 |
3.4 |
1.5 |
>6 |
|
Amylase |
10.00 |
0.0 |
0.8 |
>6 |
|
Bilirubin, Total |
20.00 |
1.8 |
2.0 |
>6 |
|
Calcium |
9.7 |
1.4 |
1.0 |
>6 |
|
Chloride |
5 |
0.1 |
0.8 |
>6 |
|
Cholesterol |
10 |
1.3 |
1.0 |
>6 |
|
CO2 |
20 |
3.1 |
3.9 |
4.3 |
|
Creatinine Kinase (CK) |
20 |
1.8 |
1.1 |
>6 |
|
Creatinine |
15.00 |
1.9 |
1.9 |
>6 |
|
Creatinine - enzymatic |
15.46 |
0.9 |
1.0 |
>6 |
|
GGT |
15.00 |
2.8 |
1.2 |
>6 |
|
Glucose |
8.00 |
0.2 |
1.1 |
>6 |
|
HDL |
20.00 |
0.9 |
2.1 |
>6 |
|
Iron |
15.00 |
3.1 |
1.2 |
>6 |
|
Lactate |
30.40 |
1.6 |
2.1 |
>6 |
|
LDL |
20.00 |
1.2 |
1.6 |
>6 |
|
LDH |
15.00 |
1.4 |
3.4 |
4.0 |
|
Lithium |
15.00 |
0.5 |
1.8 |
>6 |
|
Magnesium |
15.00 |
0.0 |
1.4 |
>6 |
|
Phosphorous |
16.39 |
0.1 |
1.8 |
>6 |
|
Potassium |
10.79137 |
0.6 |
1.5 |
>6 |
|
Protein, Total |
8.00 |
0.6 |
1.2 |
6.0 |
|
Sodium |
3.570472 |
0.1 |
0.8 |
4.2 |
|
Triglycerides |
25.99 |
1.1 |
0.9 |
>6 |
|
Urea Nitrogen |
15.00 |
1.2 |
1.8 |
>6 |
|
Uric Acid |
10.00 |
1.2 |
1.0 |
>6 |
For Alinity, if CLIA does in fact tighten the goals set for proficiency testing, there is no reason to worry that the instrument performance would be in jeopardy.
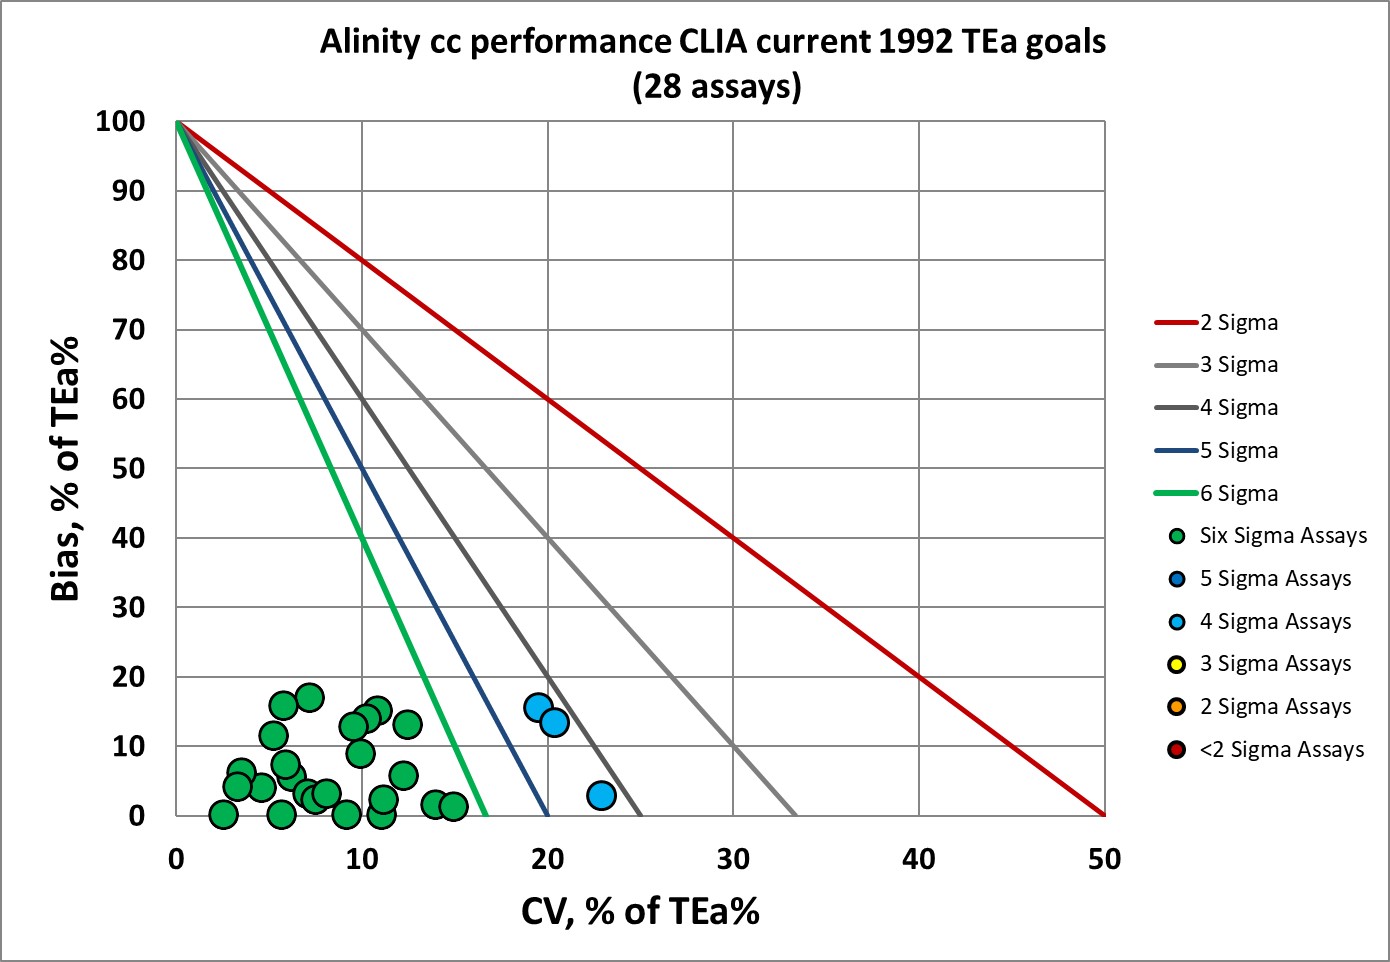
Sigma-metrics according to current CLIA performance specifications (established 1992)
Finally, the oldest set of performance specifications grades all Alinity assays at above 4 Sigma, with no assays at 3 Sigma or lower.
| Abbott Alinity performance, according to TEa goals from current CLIA regulations (28 methods) |
||||
|
TEST |
TEa |
% Bias |
CV |
Sigma |
|
Albumin BCG |
10 |
0.0 |
0.9 |
>6 |
|
Albumin BCP |
10 |
0.0 |
1.1 |
>6 |
|
Alk Phos |
30 |
3.4 |
1.6 |
>6 |
|
Activated ALT |
20 |
0.8 |
0.9 |
>6 |
|
ALT |
20 |
0.3 |
2.8 |
>6 |
|
Activated AST |
20 |
3.0 |
2.2 |
>6 |
|
AST |
20 |
3.4 |
1.5 |
>6 |
|
Amylase |
30.00 |
0.0 |
0.8 |
>6 |
|
Bilirubin, Total |
20.00 |
1.8 |
2.0 |
>6 |
|
Calcium |
9.718173 |
1.4 |
1.0 |
>6 |
|
Chloride |
5 |
0.1 |
0.8 |
>6 |
|
Cholesterol |
10 |
1.3 |
1.0 |
>6 |
|
CO2 |
20 |
3.1 |
3.9 |
4.3 |
|
Creatinine Kinase (CK) |
30 |
1.8 |
1.1 |
>6 |
|
Creatinine |
15.00 |
1.9 |
1.9 |
>6 |
|
Creatinine - enzymatic |
15.46 |
0.9 |
1.0 |
>6 |
|
Glucose |
10.00 |
0.2 |
1.1 |
>6 |
|
HDL |
30.00 |
0.9 |
2.1 |
>6 |
|
Iron |
20.00 |
3.1 |
1.2 |
>6 |
|
LDH |
20.00 |
1.4 |
3.4 |
5.5 |
|
Lithium |
23.62 |
0.5 |
1.8 |
>6 |
|
Magnesium |
25.00 |
0.0 |
1.4 |
>6 |
|
Potassium |
17.98561 |
0.6 |
1.5 |
>6 |
|
Protein, Total |
10.00 |
0.6 |
1.2 |
>6 |
|
Sodium |
3.570472 |
0.1 |
0.8 |
4.2 |
|
Triglycerides |
25.99 |
1.1 |
0.9 |
>6 |
|
Urea Nitrogen |
9.00 |
1.2 |
1.8 |
4.2 |
|
Uric Acid |
17.00 |
1.2 |
1.0 |
>6 |
Conclusion
Even though this instrument fares better than the others in our series, the latest desirable performance specifications derived from EuBIVAS are quite a challenge to achieve.