Sigma Metric Analysis
Multimode Sigma metric analysis of Alinity Immunoassays
New instruments running immunoassays - can they meet the goals of today and tomorrow? We evaluate real-world performance against goals set by Ricos, EuBIVAS, and the proposed goals of CLIA.
Multimode Sigma Analysis of Alinity Immunoassays
January 2021
Sten Westgard, MS
See the other analyses in this series:
- Beckman Coulter DxC 700
- Abbott Alinity
- Siemens Atellica
- Siemens Atellica in Romania
- Siemens Atellica in Spain
- Siemens ADVIA 2120i
- Roche c501 in Turkey
- Roche c501 in Saudi Arabia
- MicroLab RX-50 in India
- Roche cobas 6000 immunoassays in Turkey
- Sysmex XN 350 in India
- Mindray 7500 in China
- Mindray BS 2000M in China
Continuing in our series of analyzing major diagnostic instrumentation using the latest sets of performance specifications
(EFLM/EuBIVAS 2021, Ricos 2014, and CLIA 2019), we are taking a look at a recent paper on the Abbott Alinity. But for once, the paper is covering immunoassays, not biochemistry assays.
Evaluation of analytical performance of Alinity i system on 31 measurands Practical Laboratory Medicine (2020).
[Reader note: I have written papers and posters on the Alinity performance. Here are disclosures about the relationship between Westgard QC, Inc. and Abbott Diagnostics. Westgard QC, Inc. has a contract with Abbott Diagnostics covering education, training, and consulting services. Regarding this specific paper and analysis of this paper, however, no guidance or funds were involved.]
The imprecision and bias data
Two types of controls were used, an independent control from Technopath, as well as in-kit (manufacturer provided) controls. The latter are considered less reliable, as they may have been optimized by the manufacturer to provide a rosy picture of performance. For immunoassays, these performance studies are fairly rare, so we'll have to accept this weakness and retain a grain of salt when reviewing the results.
Bias was determined by comparing the Alinity with its predecessor, an ARCHITECT i2000. While this is therefore a relative difference being calculated, it may cover one of the most common customer scenarios, where a laboratory is upgrading their instruments to the latest generation.
Most of the controls ran 3 levels, with the exception of CA 15-3, which only ran two levels.
| Analyte | Level | Mean | Slope | Y-intercept | Bias% | CV% |
| AFP | 1 | 19.81 | 0.99 | 0.34 | 0.2 | 1.27 |
| AFP | 2 | 195.20 | 0.99 | 0.34 | 1.3 | 1.87 |
| AFP | 3 | 944.43 | 0.99 | 0.34 | 1.5 | 2.25 |
| CEA | 1 | 4.97 | 1.00 | -0.22 | 4.1 | 3.10 |
| CEA | 2 | 19.89 | 1.00 | -0.22 | 0.8 | 3.50 |
| CEA | 3 | 103.40 | 1.00 | -0.22 | 0.1 | 4.10 |
| CA 19-9 | 1 | 38.30 | 1.00 | 0.43 | 1.3 | 3.85 |
| CA 19-9 | 2 | 144.75 | 1.00 | 0.43 | 0.5 | 4.85 |
| CA 19-9 | 3 | 733.31 | 1.00 | 0.43 | 0.3 | 4.53 |
| CA 125 | 1 | 40.86 | 0.96 | 0.21 | 3.1 | 1.72 |
| CA 125 | 2 | 297.93 | 0.96 | 0.21 | 3.5 | 2.32 |
| CA 125 | 3 | 656.08 | 0.96 | 0.21 | 3.6 | 2.05 |
| CA 15-3 | 1 | 36.68 | 0.98 | 0.94 | 0.9 | 2.45 |
| CA 15-3 | 2 | 253.45 | 0.98 | 0.94 | 1.3 | 2.82 |
| CA 15-3 | 3 | |||||
| Cortisol | 1 | 3.830 | 1.012 | -0.140 | 2.5 | 3.24 |
| Cortisol | 2 | 15.270 | 1.012 | -0.140 | 0.3 | 1.16 |
| Cortisol | 3 | 32.760 | 1.012 | -0.140 | 0.8 | 1.42 |
| Estradiol | 1 | 43.720 | 1.028 | -3.000 | 4.1 | 5.38 |
| Estradiol | 2 | 180.240 | 1.028 | -3.000 | 1.1 | 3.62 |
| Estradiol | 3 | 578.160 | 1.028 | -3.000 | 2.3 | 2.06 |
| FSH | 1 | 4.910 | 0.973 | -0.717 | 17.3 | 1.87 |
| FSH | 2 | 25.620 | 0.973 | -0.717 | 5.5 | 2.10 |
| FSH | 3 | 77.530 | 0.973 | -0.717 | 3.6 | 2.70 |
| Folate | 1 | 3.940 | 1.085 | 0.300 | 16.1 | 3.79 |
| Folate | 2 | 7.400 | 1.085 | 0.300 | 12.6 | 3.14 |
| Folate | 3 | 16.060 | 1.085 | 0.300 | 10.4 | 2.54 |
| Ferritin | 1 | 20.580 | 1.104 | -0.853 | 6.3 | 2.96 |
| Ferritin | 2 | 141.590 | 1.104 | -0.853 | 9.8 | 2.37 |
| Ferritin | 3 | 380.220 | 1.104 | -0.853 | 10.2 | 2.41 |
| Homocysteine | 1 | 7.470 | 0.928 | 0.133 | 5.4 | 2.16 |
| Homocysteine | 2 | 13.030 | 0.928 | 0.133 | 6.2 | 2.86 |
| Homocysteine | 3 | 25.430 | 0.928 | 0.133 | 6.7 | 3.43 |
| LH | 1 | 3.780 | 0.978 | -0.035 | 3.1 | 1.94 |
| LH | 2 | 21.490 | 0.978 | -0.035 | 2.4 | 1.68 |
| LH | 3 | 43.670 | 0.978 | -0.035 | 2.3 | 1.39 |
| Prolactin | 1 | 8.100 | 1.058 | 0.077 | 6.8 | 2.06 |
| Prolactin | 2 | 20.940 | 1.058 | 0.077 | 6.2 | 1.60 |
| Prolactin | 3 | 41.930 | 1.058 | 0.077 | 6.0 | 1.58 |
| Progesterone | 1 | 0.870 | 25.92 | 96.6 | 5.28 | |
| Progesterone | 2 | 4.900 | 25.92 | 81.1 | 2.40 | |
| Progesterone | 3 | 20.910 | 25.92 | 19.3 | 2.38 | |
| Total PSA | 1 | 0.504 | 1.040 | 0.043 | 12.5 | 2.34 |
| Total PSA | 2 | 4.064 | 1.040 | 0.043 | 5.1 | 3.31 |
| Total PSA | 3 | 23.779 | 1.040 | 0.043 | 4.2 | 3.57 |
| Free PSA | 1 | 0.415 | 0.992 | -0.068 | 17.2 | 2.12 |
| Free PSA | 2 | 1.011 | 0.992 | -0.068 | 7.5 | 2.28 |
| Free PSA | 3 | 6.959 | 0.992 | -0.068 | 1.8 | 2.36 |
| iPTH | 1 | 9.780 | 1.043 | -2.500 | 21.3 | 2.78 |
| iPTH | 2 | 66.130 | 1.043 | -2.500 | 0.5 | 2.28 |
| iPTH | 3 | 270.830 | 1.043 | -2.500 | 3.4 | 1.93 |
| Testosterone | 1 | 0.060 | 0.997 | -0.012 | 20.3 | 6.04 |
| Testosterone | 2 | 0.690 | 0.997 | -0.012 | 2.0 | 2.59 |
| Testosterone | 3 | 2.320 | 0.997 | -0.012 | 0.8 | 1.64 |
| TSH | 1 | 0.093 | 1.079 | -0.220 | 227.6 | 1.55 |
| TSH | 2 | 5.753 | 1.079 | -0.220 | 4.1 | 1.26 |
| TSH | 3 | 29.280 | 1.079 | -0.220 | 7.1 | 1.99 |
| TT3 | 1 | 95.960 | 1.003 | 1.745 | 2.1 | 1.58 |
| TT3 | 2 | 143.880 | 1.003 | 1.745 | 1.5 | 1.56 |
| TT3 | 3 | 287.940 | 1.003 | 1.745 | 0.9 | 3.31 |
| FT3 | 1 | 2.920 | 0.867 | 0.217 | 5.9 | 2.97 |
| FT3 | 2 | 5.860 | 0.867 | 0.217 | 9.6 | 3.11 |
| FT3 | 3 | 10.010 | 0.867 | 0.217 | 11.1 | 1.97 |
| TT4 | 1 | 4.460 | 0.958 | 0.322 | 3.0 | 2.17 |
| TT4 | 2 | 7.610 | 0.958 | 0.322 | 0.0 | 1.64 |
| TT4 | 3 | 15.110 | 0.958 | 0.322 | 2.1 | 2.59 |
| FT4 | 1 | 0.580 | 0.962 | 0.001 | 3.6 | 3.31 |
| FT4 | 2 | 1.220 | 0.962 | 0.001 | 3.7 | 1.94 |
| FT4 | 3 | 2.830 | 0.962 | 0.001 | 3.8 | 4.00 |
| Vitamin B12 | 1 | 260.960 | 1.055 | -17.300 | 1.1 | 4.96 |
| Vitamin B12 | 2 | 476.040 | 1.055 | -17.300 | 1.9 | 4.26 |
| Vitamin B12 | 3 | 976.520 | 1.055 | -17.300 | 3.7 | 3.26 |
| Vitamin D | 1 | 20.340 | 1.023 | -0.970 | 2.5 | 2.86 |
| Vitamin D | 2 | 40.320 | 1.023 | -0.970 | 0.1 | 2.92 |
| Vitamin D | 3 | 76.020 | 1.023 | -0.970 | 1.0 | 2.38 |
What goals to use?
For many immunoassays, the current CLIA regulation does not provide PT goals. Often the only goals available for these tests have been from the biological variation databases. When CMS proposed updated goals for CLIA (hereafter referred to as CLIA 2019 goals), a lot more immunoassay analytes were brought under direct regulation. But those goals remain proposals only - they are not law.
Nevertheless, we will evaluate the ability of the Alinity to fulfill those goals, presuming that at some point in the future, they will become law.
A quick comparison of goals
For about 15 years, the "Ricos goals" were the best and largest source of information on goals for performance. While the EuBIVAS goals have supplanted them, there are still tests where EuBIVAS has not yet provided a specification (basically, no recent study has provided any data to make a performance specification), thus there are still reasons to consult the Ricos goals.
The other interesting finding here: EuBIVAS goals for immunoassays seem to be growing larger than the Ricos goals. This is the opposite of what has been seen on the biochemistry side, where EuBIVAS goals are often so tight they are impossible to achieve (thus, making the Ricos goals attractive again).
The proposed CLIA goals have a 2-part specification, a unit-based goal near the low end of the range, and a percentage-based goal at the upper end of the range. For comparative purposes, we are just looking at the percentage goal here.
|
Imunoassay |
Ricos 2014 |
EuBIVAS 2021 |
CLIA 2019 |
|
AFP |
23.7 |
27.7 |
20 (upper range) |
|
CEA |
24.7 |
26.9 |
15 |
|
CA 19-9 |
46.03 |
26.9 |
|
|
CA 125 |
35.4 |
20 |
|
|
CA 15-3 |
20.8 |
||
|
Cortisol |
22.8 |
32.5 |
20 |
|
Estradiol |
26.86 |
17.3 |
30 |
|
FSH |
21.19 |
21.2 |
18 (upper range) |
|
Folate |
39.0 |
30 (upper range) |
|
|
Ferritin |
16.9 |
13.8 |
20 |
|
Homocysteine |
15.48 |
||
|
LH |
27.92 |
28.4 |
20 |
|
Prolactin |
29.4 |
24.8 |
20 |
|
PSA Total |
33.6 |
16.2 |
20 (upper range) |
|
PSA Free |
33.6 |
17.5 |
20 (upper range) |
|
iPTH |
30.2 |
20 |
30 |
|
Testosterone |
13.61 |
17.0 |
30 (upper range) |
|
TT3 |
9.22 |
11.6 |
30 |
|
FT3 |
11.3 |
9.3 |
18 |
|
TT4 |
7.0 |
8.7 |
20 (upper range) |
|
FT4 |
8.0 |
9.6 |
20 (upper range) |
|
Vitamin B12 |
30.0 |
25 |
|
|
Vitamin D |
20.5 |
Sigma-metric performance: Ricos 2014 Desirable Specifications
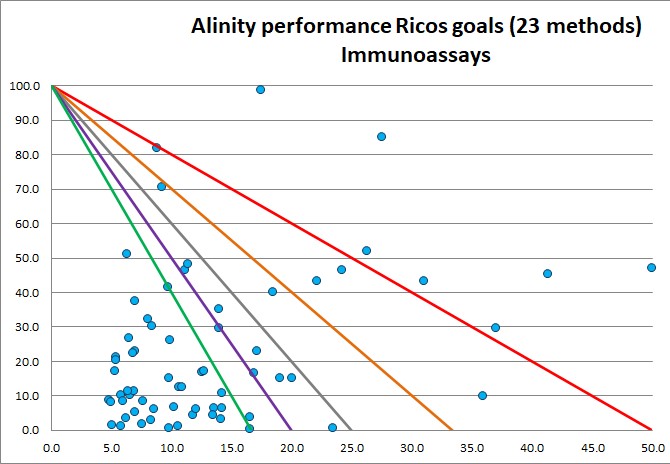
Out of all the levels measured, 63.2% are 6 Sigma or better, 2.94% are 5 Sigma, and 11.76% are 4 Sigma.
So if we take 4 Sigma and higher as our goal for good performance, we would reach about 77.94%. On the chemistry side, this is what we aim for, hoping to reach around 80%. So it's impressive to see the performance of immunoassays about as good as the chemistry side.
The other side of this, the number of performance levels below 3 Sigma, is about 19.12%. Some of the performance at low levels of the tests is challenging - but if we were analyzing with more detail, we might decide those low level areas are not as clinically relevant for some tests.
Sigma-metric Performance: EuBIVAS 2021 specifications
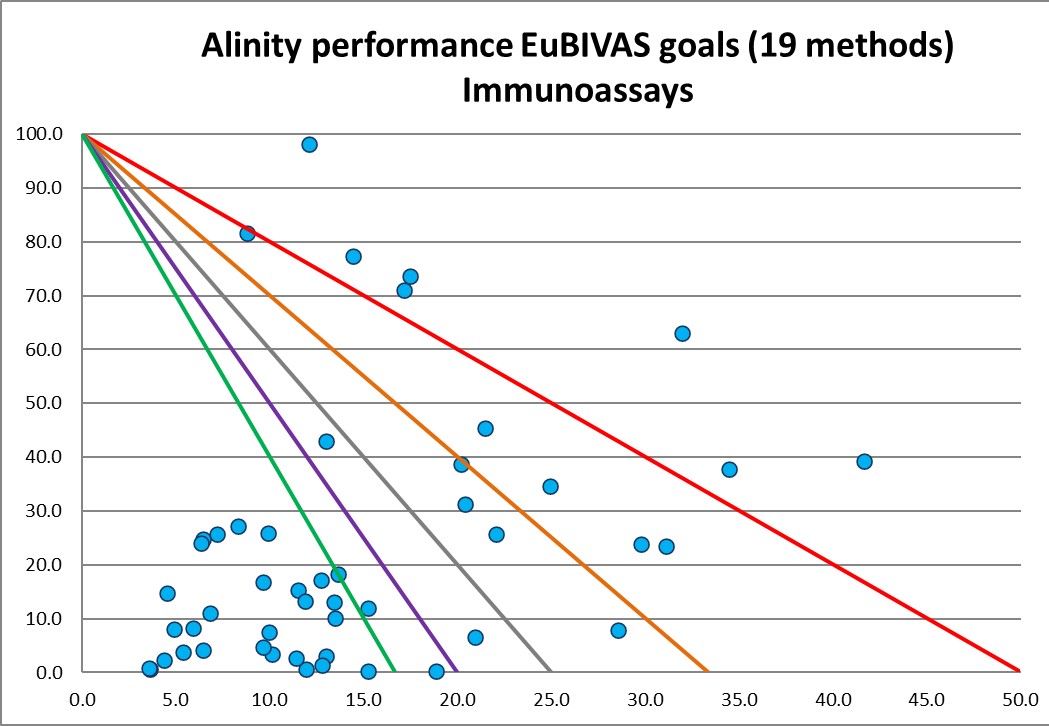
As we said earlier, there are 4 fewer assays covered by the EuBIVAS goals. But of what is covered, there were some goals bigger, other goals smaller, than the Ricos goals.
Here only 56% of the assays can reach 6 Sigma, 3.51% can reach both 5 and 4 Sigma. 29.82% is less than 3 Sigma.
So a larger number of levels cannot meet the EuBIVAS goals, almost a third of the performance. Troubling if we think this instrument represents the highest achievement of instrumentation the market can provide. So again this provides more evidence that the EuBIVAS goals may be more evidence-based, but they may also be less realistic or practical for today's laboratories.
Sigma-metric Performance: Proposed CLIA 2019 goals
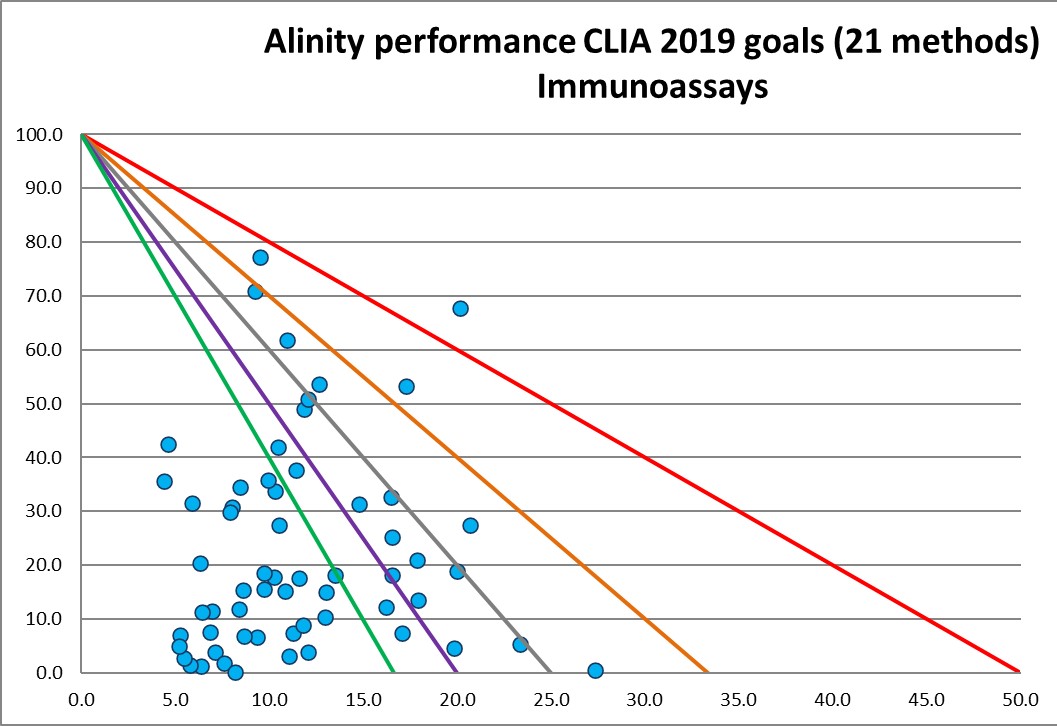
So even if there are updates to CLIA goals, they are the easier to achieve than the EuBIVAS goals. Less than 10% of the performance levels are below 3 Sigma, while 73.73% are 4, 5, and 6 Sigma. Interesting that CLIA goals are actually harder to achieve than the Ricos 2014 goals.